We can compare the chart of Bitcoin at 2013 and 2018.
There was serious Market Correction/Crash in 2013 same as now.
What causes the market to crash/ correction?
Well, Market Corrections typically happen in 3 waves:
- Profit Taking
- Panic Selling
- Bargain Buying
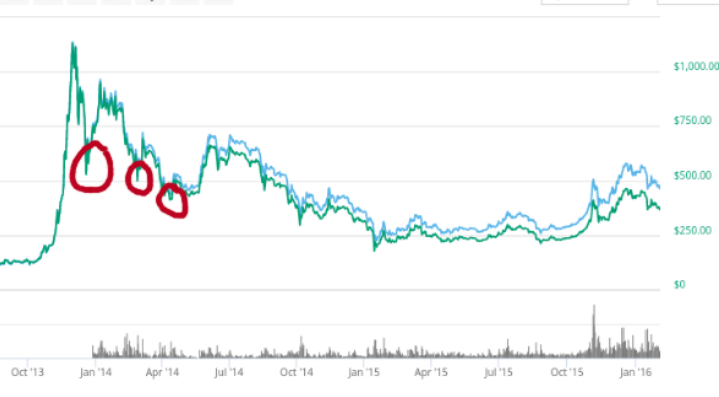
2013/14 crash
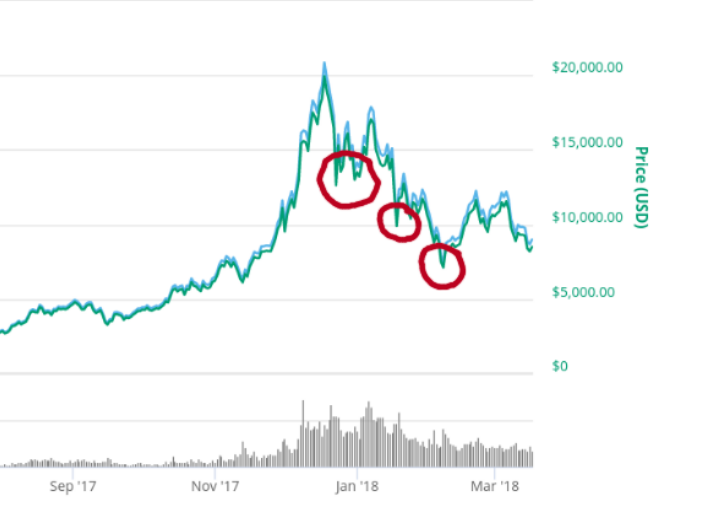
2018 crash
On looking at the graph, the price of Bitcoin dropped from All Time High of above $ 1000 to lower than $ 250. It means it dropped more than 75%
Now other things if we suppose the same, and if we only consider trend line or historical data: The All Time High of 2017/18 was around $ 20000.
If it drops more than 75% as that of 2013/14, the price of Bitcoin shall drop to less than $ 5000. ($20,000-75%×$20,000 = $5,000)