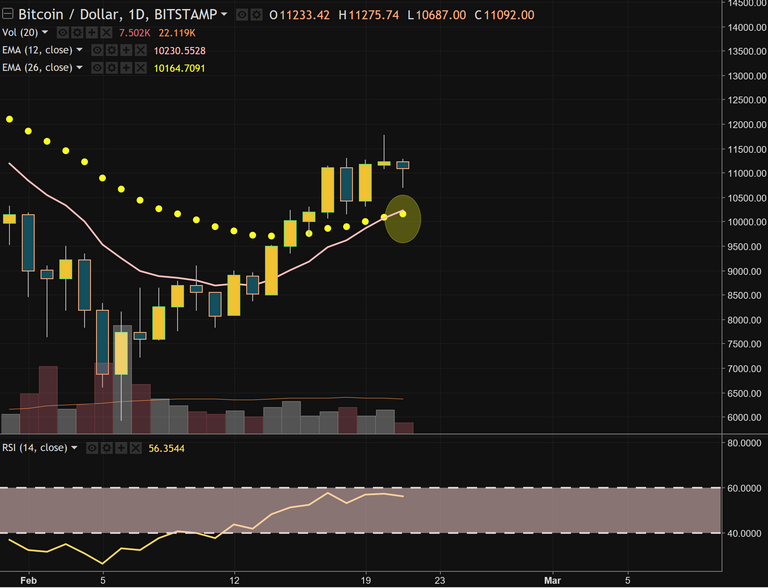
Barring an epic collapse in price, at the close of trading tomorrow, the daily chart of Bitcoin will experience a bullish moving average crossover with the fast 12 EMA rising above the 26 EMA on a daily closing basis.
The last time this event happened was in late September 2017.
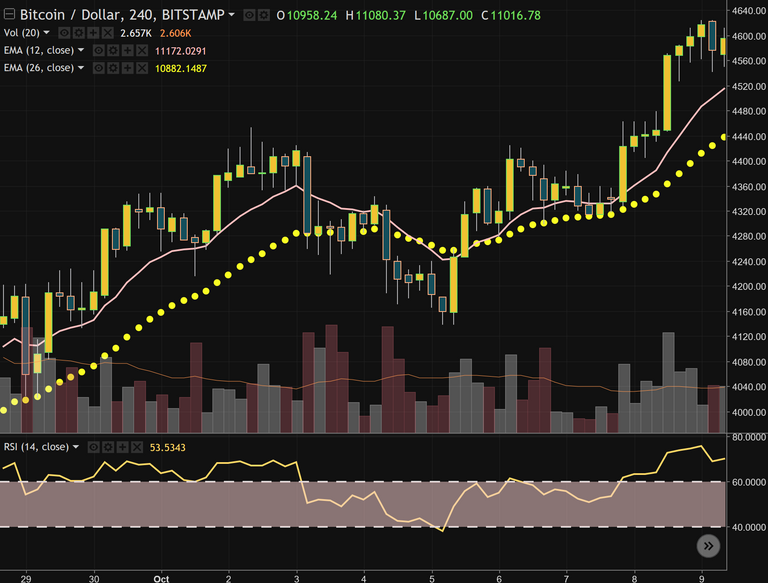
The 4-hour chart from that period might be a model for how the price action may play out in the coming days.
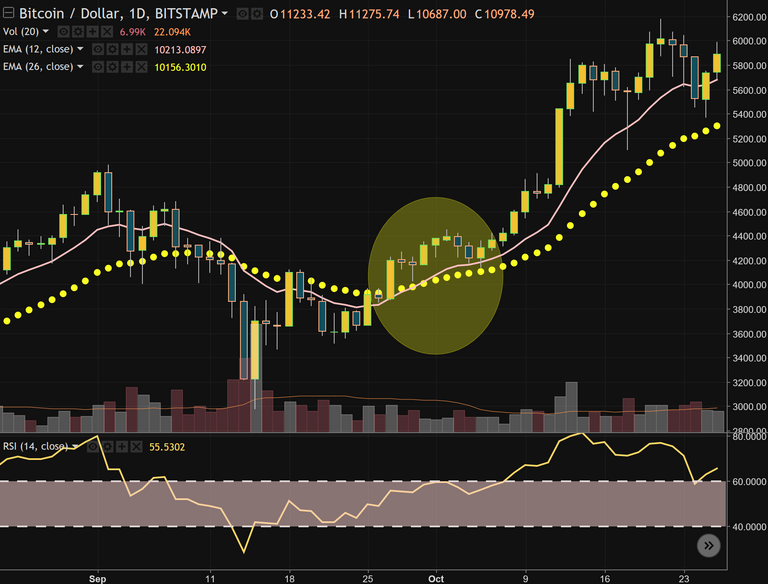
September 2017
In late September and early October 2017, the daily chart experienced the aforementioned bullish crossover and then pulled back to retest the moving averages.
A look at the 4-hour chart shows us the dip took the 4-hour RSI below 40, before surging higher.
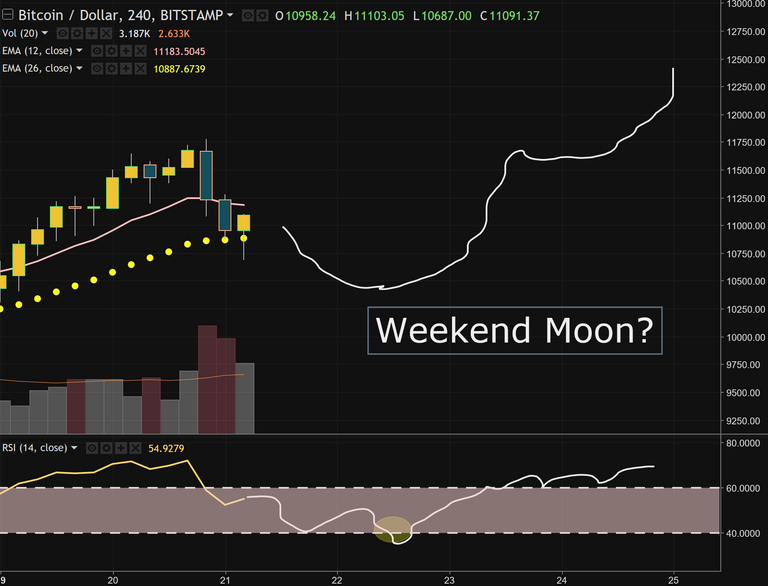
Current Price
The daily chart is currently showing a bullish moving average crossover, though not yet on a daily closing basis.
As show above, if the 4-hour chart behaves like the version from early October 2017, this weekend could be moon time.
DISCLAIMER
This post is for information and illustrative purposes only. It is not, and should not be regarded as “investment advice” or as a “recommendation” regarding a course of action.
SUPPORT
Bitcoin: 19498NLGwLbzN7yKrNbYqc4wuwZPkTGMVD
Ethereum: 0x76F2D78c81C6C97473DaF2aa3219F78Ce8C5A92f
Litecoin: LNhKXYTC5t2ZxcKYfo3pMzk8QsjZXsEbgT
CONTACT
twitter: sjanderson144
instagram: sjanderson144
Thanks, nice presentation. I like people to do lookbacks like this, GOOD JOB.
Thanks, @toadslinger . I appreciate your kind words. Yes, lookbacks, I've found, are very worthy of attention.