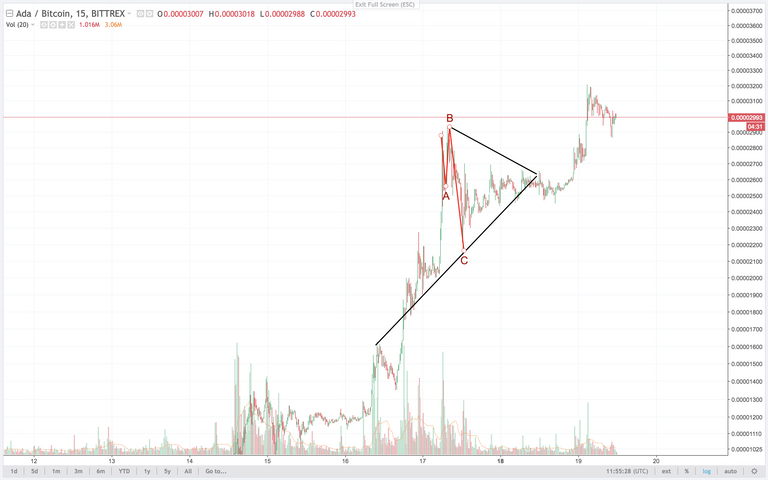
@solisrex what made you decide to predict a symmetrical triangle?
It looks like it is forming one, but how did you predict that so early? rather than a descending triangle or flag pattern?
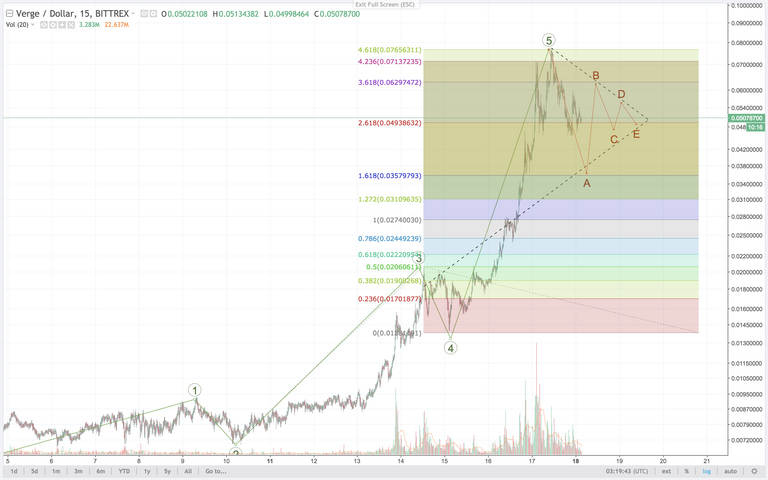
still tracking towards 3.6 cents on A right?
Thanks for the awesome graph Sol.
So your thoughs are:
-Buy at 1618?(bottom of A)
-Sell at 361.8
-Buy at 2618?(B) (or wait for new pattern.)
Excellent analysis (at least in the eyes of a noob).
Thankyou for the guidance. (I'm HODLING but keen to see how your tracking goes as I learn).
Thanks for the alternate count Solis.
What do we need to see, and by when, to avoid a monstrous dip like that?
Can you explain what market conditions would cause a crash like that- would it be multiple wales just pumping and dumping?
What time basis would you trade corrections on?
Thankyou
@solisrex what made you decide to predict a symmetrical triangle?
It looks like it is forming one, but how did you predict that so early? rather than a descending triangle or flag pattern?
I start my bottom support line at peak of wave 3 and find local support levels.
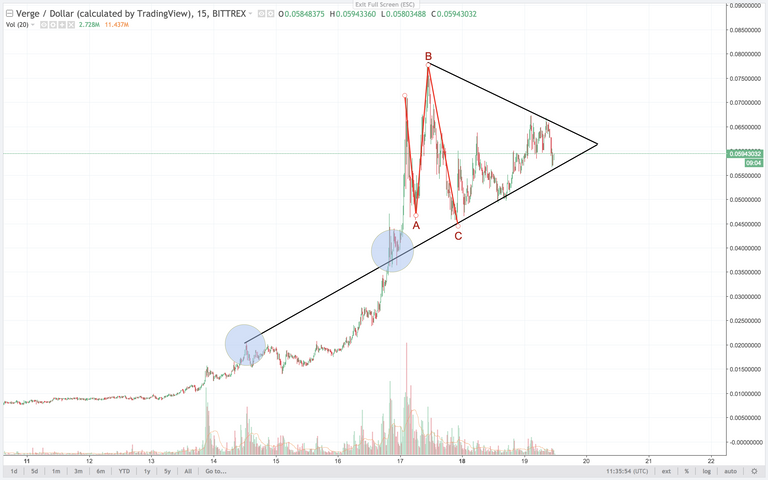
Symmetrical triangles often start with expanded flat.
very nice! I didn't know that about the triangles, thank you brother.
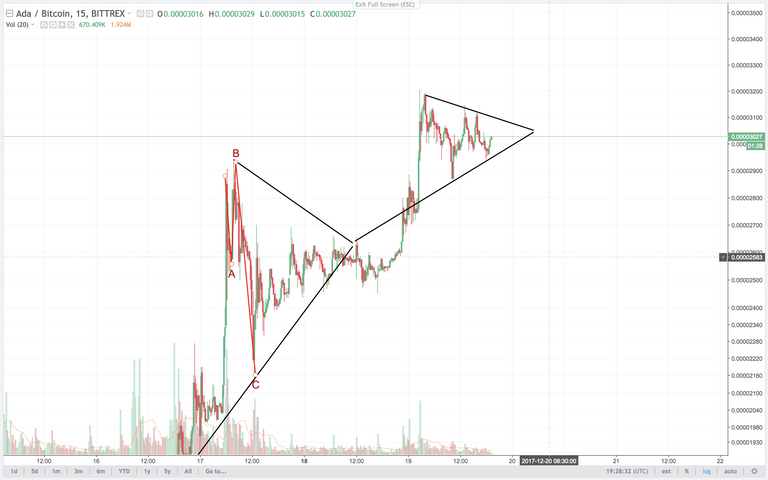
ADA fractal repeated.
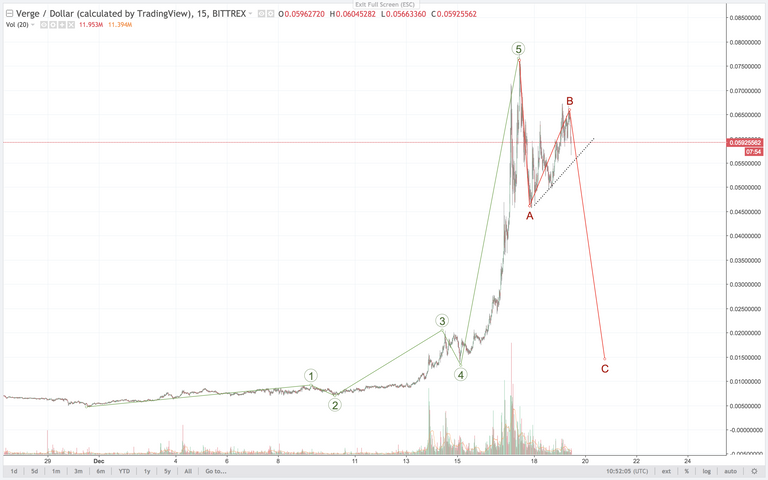
@solisrex can you please help me with XVG???
I bought in thinking its going up. can you please re evaluate it?
XVG and DGB look like 1 more wave up??
here is what I have?
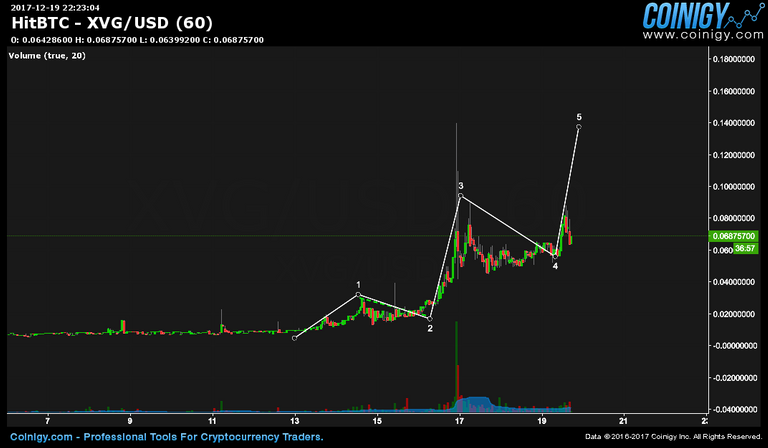
What do you think?
@scarlet7 @haejin @solisrex
Looks good to me. Secondary would be wave c to 0.02
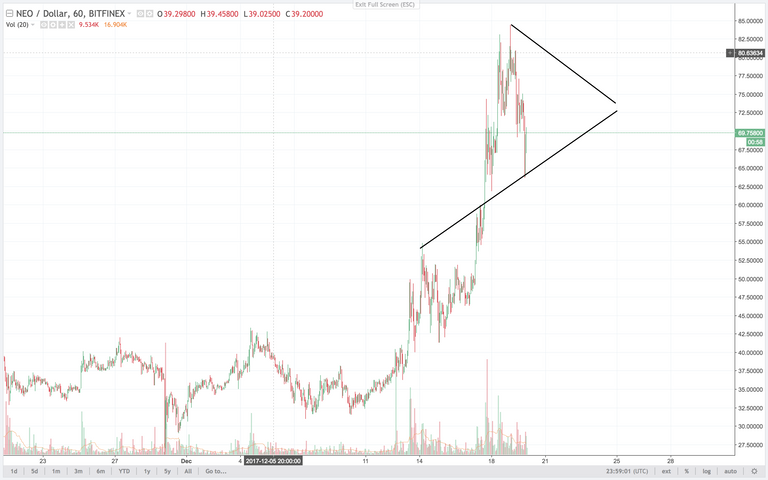
Neo has my fractal.
I think EMC2 and ADA are leading the fractals.
ADA is leading
I don't know what that means, please explain
Please watch Haejin's tutorials. They are beyond masterful.
still tracking towards 3.6 cents on A right?
Thanks for the awesome graph Sol.
So your thoughs are:
-Buy at 1618?(bottom of A)
-Sell at 361.8
-Buy at 2618?(B) (or wait for new pattern.)
Excellent analysis (at least in the eyes of a noob).
Thankyou for the guidance. (I'm HODLING but keen to see how your tracking goes as I learn).
Trading corrections on a 15 min chart is not recommended. This is also a possibility.
Thanks for the alternate count Solis.
What do we need to see, and by when, to avoid a monstrous dip like that?
Can you explain what market conditions would cause a crash like that- would it be multiple wales just pumping and dumping?
What time basis would you trade corrections on?
Thankyou