Hey
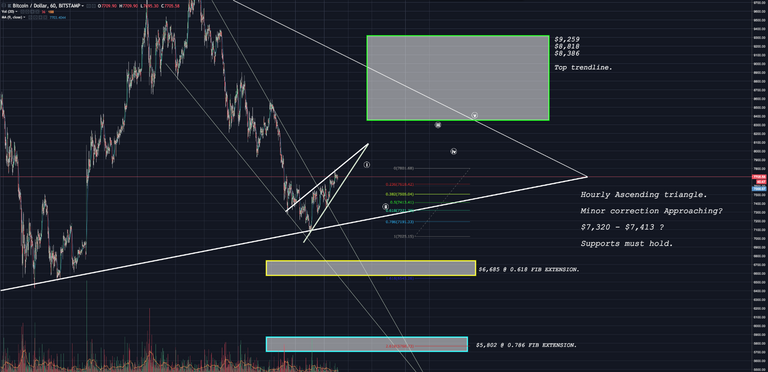
#BTC movin in a nice lil ascending triangle, which may count for wave one upwards towards our upper trendline.
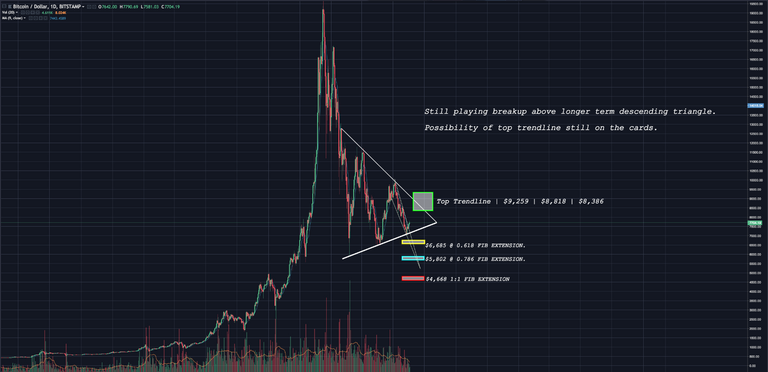
The break from our long term descending triangle has provided some bullish momentum, and we have so far held above its previous resistances.
On the Daily it still looks likely that a test of the upper trendline will occur.
On the Hourly, it is showing bearish signals with an asending triangle forming.
If this is to break down we may see a steady decline too around $7,320 - $7,413.
If this is not to hold we may again retest the bottom trendline in a more bearish situation.
Watch my chart indicators for more info. enjoy!
Shorter Term - HOURLY
Longer Term - DAILY
Legal Disclaimer: I am only as good as guesses and fibonacci , i love to share my information however i am not telling anybody to specifically follow in any of the trades or decisions i make. I win , I lose but at the end of the day i use this all as a platform to share my opinions on possible outcomes and trades i will be completing. Happy Trading!