HELLO GUYS,
TA BTC 1D Chart
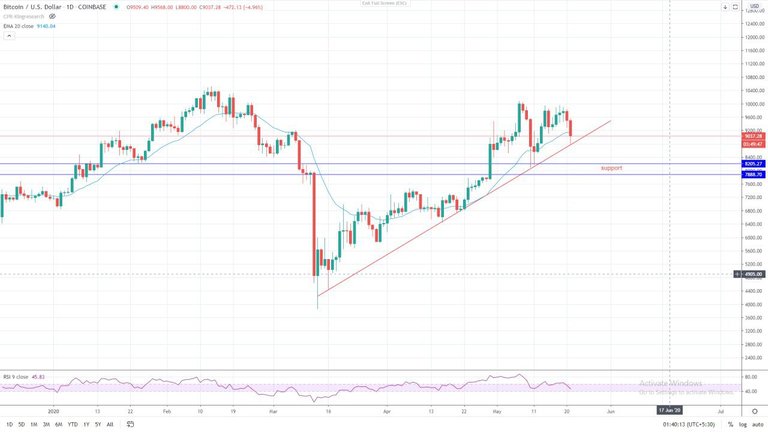
Chart siting now 9050USD channel support and 20ema holding look nice retracment .if it want uptrend continous need to respect current ema levels on daily chart.
scenario 1
📉 IF BTC today 1D candle close below 9050$ ,we might see correction to 8200$ - 8550$ levels tommarow.
Scenario 2
📈If BTC 1D candle , manges to close above 9250 and price ejection from 9050$ Then potentially will breakout and will be heading Towards $9700$ - 10000$ again
Lets see daily close to check where it gone
THANKS...
Nice information