Today I would like to point out a major trend line. The break or rejection is imminent within the next two weeks.
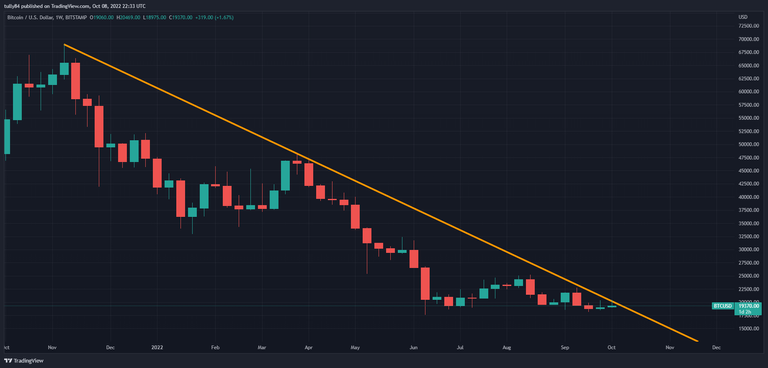
BTC has not broken the down trend on the weekly charts. There is one day left in this weekly candle. It is unlikely to end a candle above the trend line this week but, it did push a wick through the trend line.
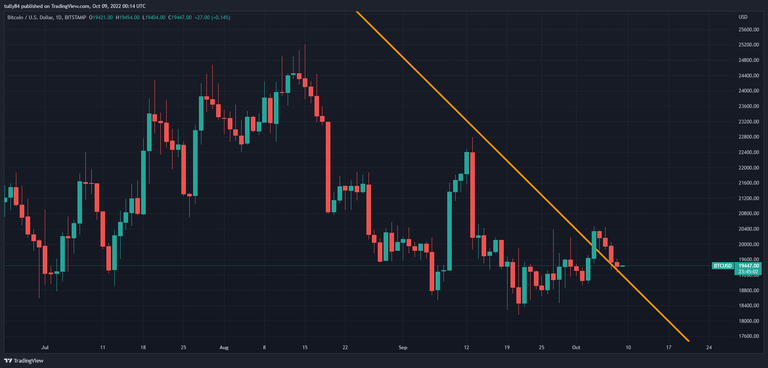
If we zoom into the daily candles we can see that we broke through the trend line and we are currently retesting it as support. The break through the trend line did not have much volume. If this retest holds for one more day, next week could bring volume and a break of the previous high (green line). If this happens we would get a volume break of the weekly trend line.
We are also getting support on the 21Moving Average.
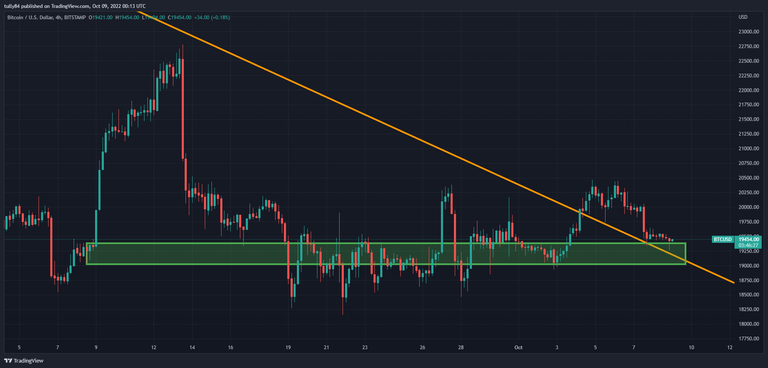
On the 4h chart I bought in the green box. My plan is to hold as a swing trade. My termination point is below the previous low and My first take profit will be around $28700
This is my trading plan. Do you own research and make your own decision.