Both Bitcoin and Litecoin traded mostly flat since our last update seven days ago. Bitcoin is quoted at $3,920 dollars per coin right now, down from $3,974 last Tuesday. Its little brother is trading at $52.71, down by 3.1 percent.
Bitcoin Mostly Flat
Bitcoin prices are down by $54 since our update last week. In percentage terms this is only 1.36%. This calming follows a period of high volatility during which prices fell over $1,200 in three days, only to recover most of the losses in the next four days. Since then we bounced back and forth between the $3,500 and $4,000 handles.
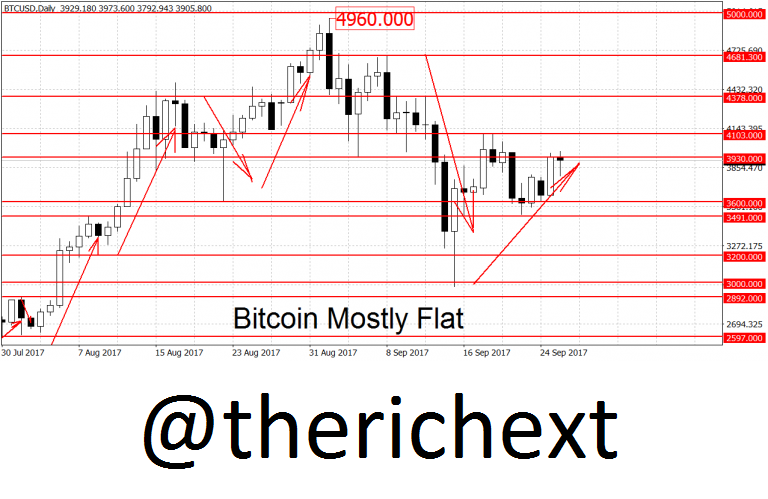
Regardless of the range during the past week, the trend on the daily charts remains down. The bulls need a breakout above the $4,103 swing high to definitively end the downtrend. A move beyond $4,681 dollars per coin could start a new rally and open the door to the $5,000 handle. A breakout above this important round figure could see accelerated gains in prices.
On the lower end we have support at the $3,500 round figure. This is where the bulls halted the few tries of the bear squad. A decisive break of this level could lead us to the second important support around the $3,000 handle. A move below this month’s low at $2,970 should lead to further BTC losses. Despite the downtrend on the daily, on the longer-term weekly and monthly charts BTC/USD is still in an uptrend.
Little Change in Litecoin Prices
Similarly to bitcoin, we’re seeing little change in the price of LTC/USD this week. The altcoin is only down by $1.7 dollars or 3.1 percent since last Tuesday. This is a negligible amount in the volatile crypto-currency world. The lack of news from China certainly helped to calm things down a bit.
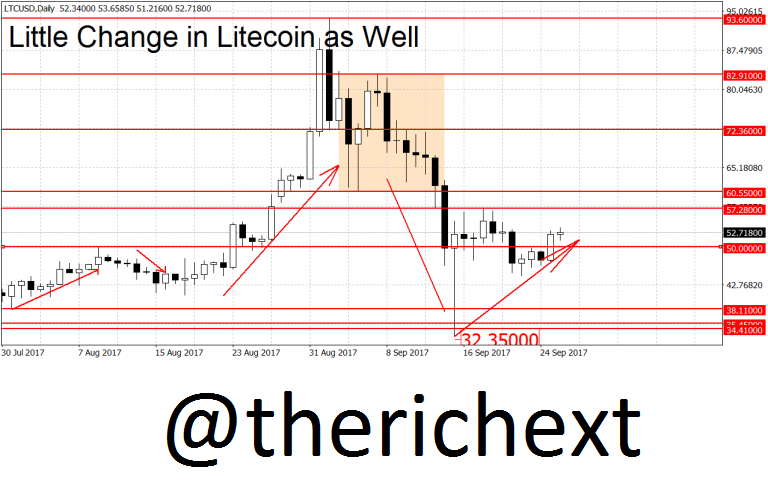
Litecoin remains in a downtrend as well. A break above the $57.28 swing high is needed to end it. A move beyond $82.91 dollars per coin could re-start the rally. Support on the way down can be found at the $50 round figure, followed by the $44.47 and $40.74 swing lows. A break below the $40 round figure could open the door to the crash lows at $32.35 dollars. On the weekly charts LTC/USD is range-bound. The monthly chart is still showing a bullish bias.
If do you like this post so please resteem follow and upvote @therichext thanks for support me.