
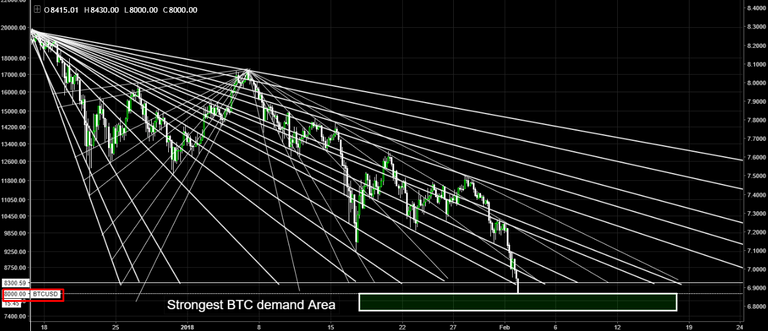
Geometric pattern of crossed lines
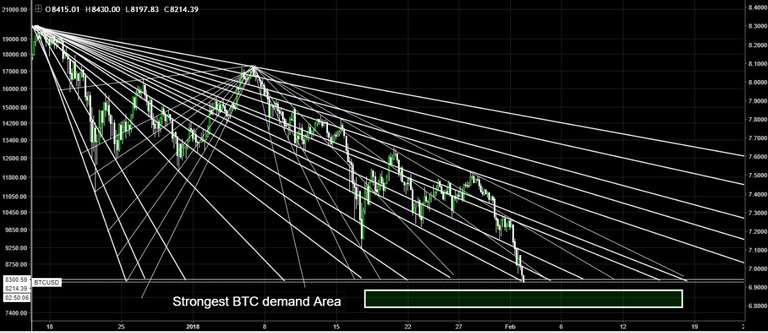
If the BTC continues with this trend and enters the extreme level (condition Yes and only yes) of consolidation to then do its recovery and bullrun, how the title of the post says it.
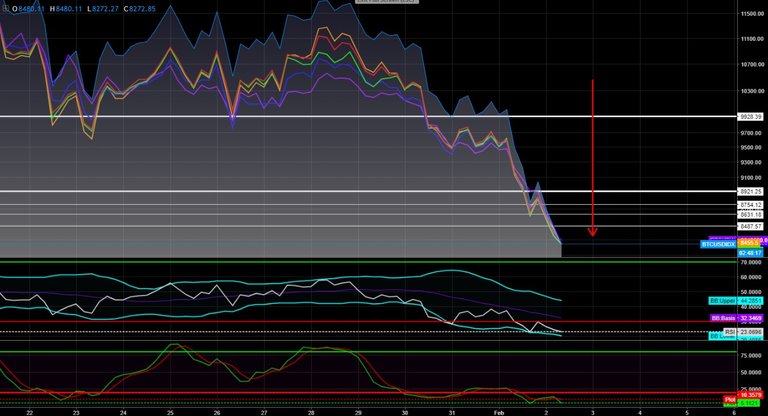
If before, It must go through the 8.3 / 8.2 / 8.1k all graphs match that we go in that direction and enter inside of
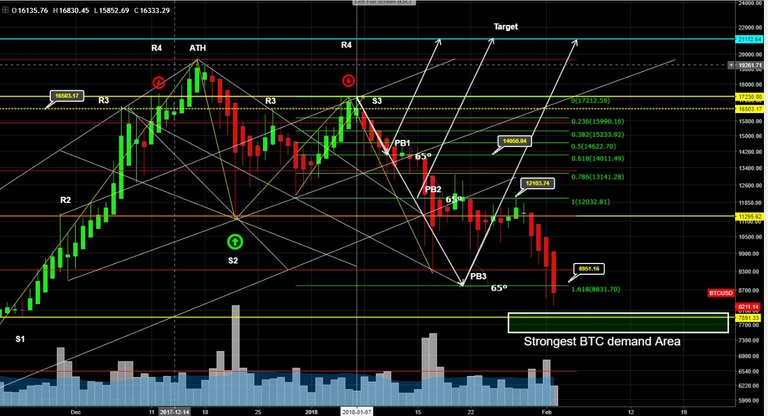
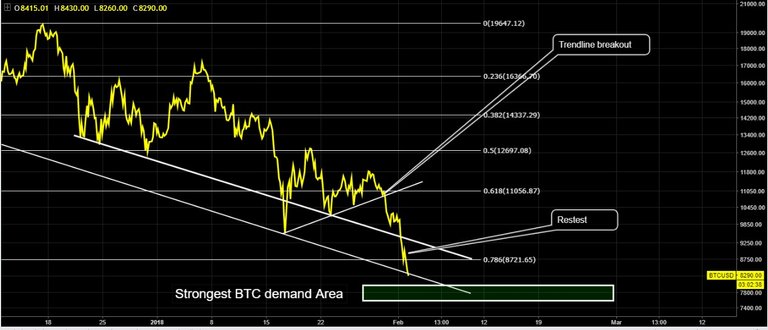
The most BTC demand area RANGE 8K/7.8K)
BTC / USD Bitstamp Chart Global TF daily
BTC / USD TF 4hs
Zoom:
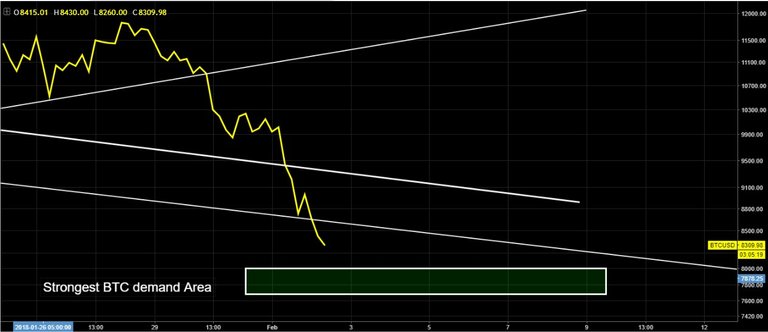
BTC Global Signal TF 240
Thanks for your time and reading!


Fingers crossed :D
If the price enter in that area, it will be, in my opinion, the last time we have an opportunity like this.
Thanks for comment!
Maybe. Who knows :D
Done, now wait.
That clickbait photo is awesome