In today's review, as always, we will summarize this week, we will analyze the general price dynamics.
BTC / USD
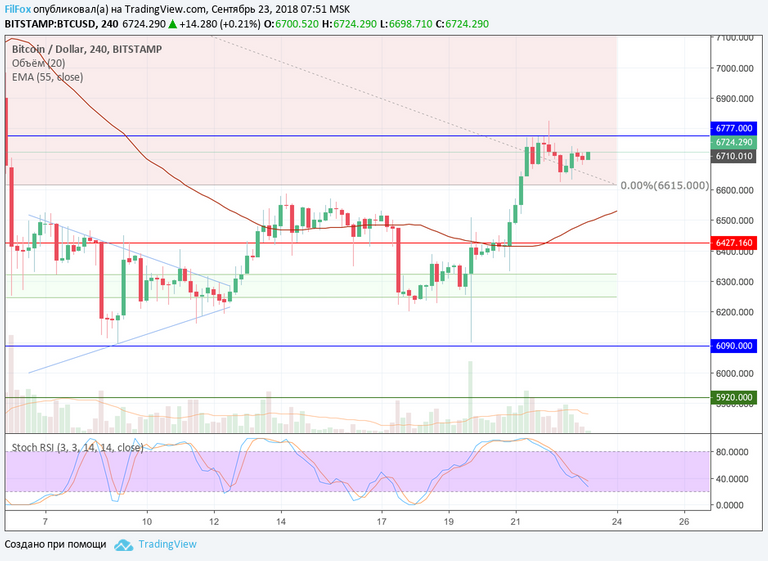
Last weekend, Bitcoin was traded at very low volumes and the price fluctuated peacefully in the lateral range above the support level of 6427.16 USD. This level has become the basic level, crossing the current trading week by a red line.
The week began with the price falling significantly below this level in the green support zone and consolidated until September 19, pending the expiry of the BTC futures contracts on the CBOE exchange.
At the close of the bitcoin futures, the volatility of many cryptocurrency pairs has risen sharply. The price of Bitcoin by impulse jump and a very large volume, has dropped to a minimum of 6100.00 USD, then with volumes twice as big, to a maximum of 6510.00 USD. After about two hours, the pair continued its lateral movement in a narrow range, below the resistance level of 6427.16 USD, as if nothing had happened.
On September 20, the SEC issued a statement that the Securities and Exchange Commission, considering the Bitcoin-ETF issue, needed more information. The market, in fact, did not react to this news, probably because the SEC's decision was eagerly awaited.
This Friday, resistance at the key level of 6427.16 USD was overcome and, continuing growth yesterday, the price tested the level of 6777.00 USD. However, the low transaction volumes and the lack of activity of buyers in the market prevented this resistance from penetrating. The pair retreated to support the Fibonacci zero level of $ 6615.00 and is further consolidating in this range.
We expect that until the end of the day, consolidation will continue and then, on the BTC / USD weekly chart, a second consecutive green candle will be set.
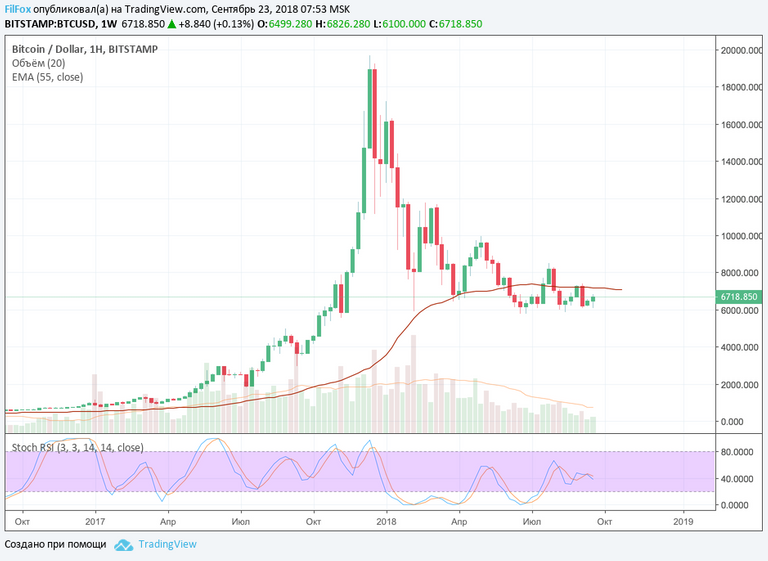
Another week of positive momentum is coming to an end, resulting in an increase in total market capitalization from $ 200 billion to $ 225 billion. Due to the dynamic growth of the altcoins market, the Bitcoin dominance index has increased from 57% to 51%. It is possible that next week will be the third week of market growth, after which the recession will begin.
ETH / USD
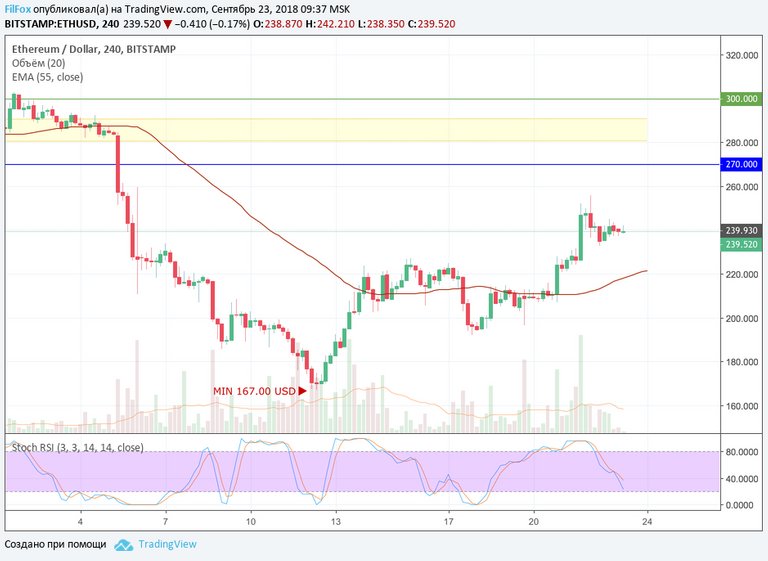
Ethereum like Bitcoin had started the week with a dip, but unlike the BTC, there was no high volatility on the ETH / USD chart. Ether growth began synchronously with the rest of the Friday's altcoin market, but was less dynamic than Ripple's.
Despite this, the weekly will be closed to green light, while the capitalization of assets, since Monday, increased by $ 5 billion and reached this Saturday the $ 25 billion.
XRP / USD

The XRP / USD is one of the most active this week. From a low of $ 0.266 at the beginning of the week, the price reached a weekly maximum of $ 0.767, which was set on Friday.
Such active growth is associated with the promotion of xRapid, the new product for institutional investors. And even though, at the end of the week, the price fell to $ 0.600, investor sentiment in this asset is rather optimistic.
- All prices are based on BitStamp data
I would like to have your support to create content more often.
BTC: 1Bj9sdebQc9SpSc7aV3eb1VLccMdReXb8Z
ETH: 0xD2d4Ef745dbF0fb9f1B67Ee6071a5344Aa993dFE
LTC: LgTbkLn24cv2MgurW4dMjNayvCa6BJC2hs
thank you
Coins mentioned in post: