As I was also saying in my last video, from yesterday, we are setting up for a break-out on the BTC/USD chart from Coinbase.
https://www.tradingview.com/x/pGPW9Y1j/
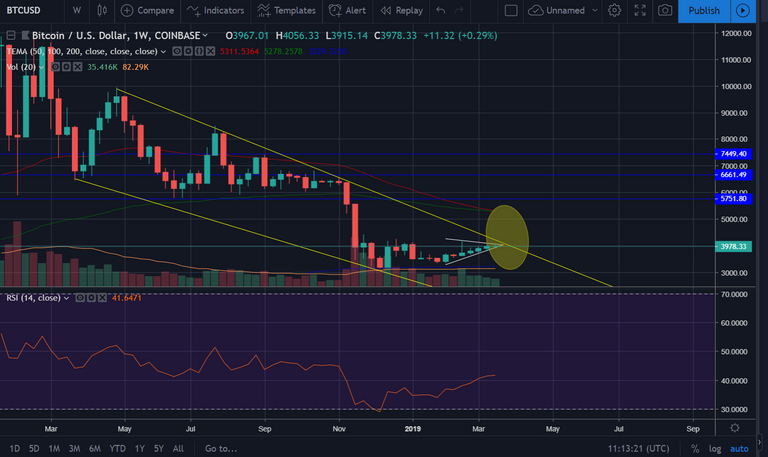
We are looking at the weekly chart, and you can see we're getting closer to the top channel resistance, as well as the tip of the triangle. This signals a swing either way, up or down, but my POV is that this will be up, and we be going for the 5k levels in the following weeks.
As we get near the anniversary of 1 year before bitcoin halving, we can expect the end of the accumulation period nearing, going into a slow but steady uptrend in the following year, where we may challenge the 11k level by the end of the year.
Keep your eyes on the price action the following weeks, and consider accumulating if the price spikes above the tip of the triangle and outside the downward channel, signaling a break in the bearish market, and hopefully a new setup for a bullish trend.
What do you guys think will happen next?
Bouncing around, continues to fail and will break to the bottom. 3900 first.
For the moment it's keeping within the triangle, positioning for a positive breakout, but interesting to see if it will dip first. Low volumes may support your theory, too, but that is if it gets rejected when hitting the yellow line.
nobody knows :)
Posted using Partiko Android
So I was right, huh? :)