(German)
das ist ein vergeich von btc zu 2 verschiedenen zeiträume. Oben sieht man eine BTC flag (dieses komische dreieck), im sommer 2017, die darin mündet, dass der Preis komplett einbricht, bis zu den gestrichelten Linien, die frühere resitancelevel darstellen (in dem Moment wo ein resistance level durchbrochen wird, wird es oftmals zu einem Supportlevel). Nachdem der Support getestet wurde und hält, gibt es einen ziemlich heftigen Aufwärtstrend, der in neuen ATH mündet. Genau dieses Szenario glauben Leute (mir inklusive) in dem jetzigen Setup zu erkennen. Das schöne an solchen Mustern ist, dass sie oftmals eine self-fulfilling prohecy darstellen. D.h. wenn genug Leute daran glauben, dass sich das Muster wiederholen kann, dann wiederholt es sich auch, einfach weil alle so handeln als wäre es eine unumstößliche Wahrheit. Es gibt tausende solcher Muster (ABC, Elliot Wave, etc). Diese Muster funktionieren nur, weil Leute daran glauben oder trading bots darauf programmiert sind. Ob du für deinen chart das richtige Muster hast stellt sich entweder an der Vergangenheit raus (viele leute die dieses asset traden glauben an eine bestimmtes Muster-> es tritt ein -> dient als blaupause für die nächste bewegung und so weiter und so weiter). Es kommt also bei der Analyse darauf an, an welches Muster du glaubst und an welches Muster die Market Maker glauben. Wenn das matcht, kann man ganz gut mitschwimmen. Ich hoffe ich habe das einigermaßen laienhaft erklärt.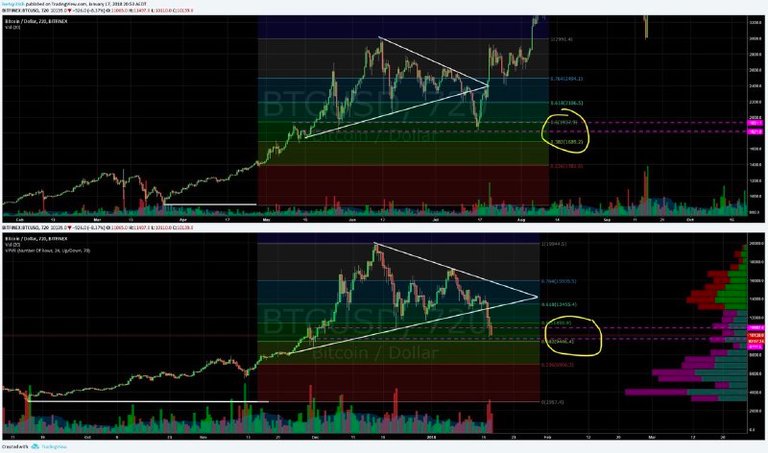
(English)
this is a comparison of btc at 2 different periods. Above you can see a BTC flag (this weird triangle), in the summer of 2017, which breaks down the price completely, to the dashed lines that represent the previous resitancelevel (the moment a resistance level is breached, it often does to a support level). After the support has been tested and keeps up, there is a pretty hefty uptrend that flows into new ATH. Exactly this scenario people (including me) in the current setup to recognize. The beauty of such patterns is that they often represent a self-fulfilling prohecy. That if enough people believe that the pattern can repeat itself then it repeats, just because everyone acts as if it were an irrefutable truth. There are thousands of such patterns (ABC, Elliot Wave, etc). These patterns only work because people believe in them or trading bots are programmed for them. Whether you have the right pattern for your chart turns out to be a thing of the past (many people who trade this asset believe in a particular pattern -> it enters -> serves as a blueprint for the next move and so on and so forth). It therefore depends on the analysis, which pattern you believe in and which pattern the market makers believe. If that matches, you can swim along very well. I hope I have explained that reasonably amateur.