Hi,
Let me do a quick #BTC/USD trend analysis for you. I'm a trader and I'd like to show you where we are going.
I know there is a lot of technological speculations on #BTC price and a lot of manipulation hypotheses including #USDT but leaving all those stories on side I'd like to make typical technical analysis for you chaps. Here we go.
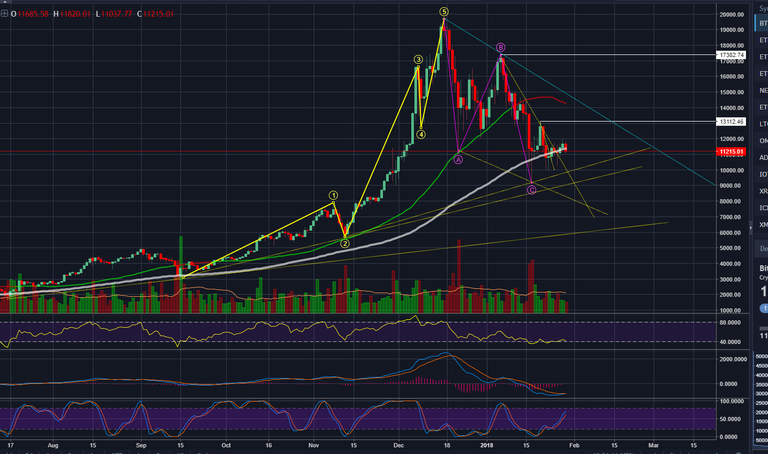
What we see on Daily [1D - one candle (green/red) represents one trading day] is ongoing correction which is about to end if not ended already. #BTC wave represents typical 5 step Elliott's wave with triple wave (ABC) correction pattern. It looks simple, silly but trust me, #BTC market works very well with classical and simple patterns and moves due to it's high Market Cap. After 3 correction waves (ABC) trend line is just touched SMA100.
For those not into trading - SMA100 is Simple Moving Average on 100 interval periods sample (in given example 1 period equals 1day). This shows general trend in long term. It is trustworthy and simple indicator of towards which direction given asset is heading.
When we cross SMA from top side it usually means that we are still downtrending and we might expect further drops. This time however #BTC gently stopped at this secure level and slowly consolidating. Because we are just after huge correction pattern which is followed by new uptrends which always result in new ATH (all time high) it is a very promising moment.
Other indicators such as RSI (Relative Strength Index) shows how much the market is Oversold or Overbought. At the moment #BTC is scratching very low RSI levels which again are followed but up trend. This usually goes to 70+ RSI and then bounced back low again.
MACD (moving average) shows positive divergence and when Blue line is crossing Orange from bottom side this is an indicator for bullish market.
There is also Stochastic RSI which is a bit simlar to RSI but I will leave it for now with a comment that it is positive :) It is an oscillator which goes up and down that represents market direction.
I'm pretty confident saying that we are going to see new ATH. Will it be 30k, 50k or maybe 100k? I have no clue but definately huge days are coming. When? Being realistic we need to wait couple of months as this market moves quite slow in long term but it means you will have plenty of time to jump on that train called Orient Bull #BTC :)