Cause I made it to quick. You can just lay the top line on the right red candle.
Check out 30 charts and you can see a lot of simmilar movements. Don't be affraid of pulling lines yourself. On the short term correct it everytime a candle passes a line. I do this on a one hour chart and only correct the line when the hour is over. This way it tells you more and more were it wants to go without any guarantee! And trust these lines you did draw untill the candle it finished. (It speares you to chicken out)
As you can see in my BTC chart (scroll to the top of this page) I put a lot of lines in there.
Trentline top: it tells you in the long term if it's bulish or bearish
Trentline bottom: if it breaks that.............get out, or wait and buy in.
Horizontal bottom line: Just take the lowest part at the earliest left.
It really isn't that difficult, you just have to do it again and again and again and learn it yourself this way. During time you'll get better and better in it. And remember a coin can go from 0,20 to 2,-- but it can also go from 2,-- to 0,20. Nobody wants that, but it happens.
Because there are not puts and calls like in the traditional stockmarket. Movements are more volatile but also more like nature. Most of them look like waves that are heading for the beach.
Always start your chart as a day to day chart and look at the whole picture.
At uk.tradingview you can select day and hour at the top right.
Happy trading
Cheers. I'm hoping it breaks upwards from this small triangle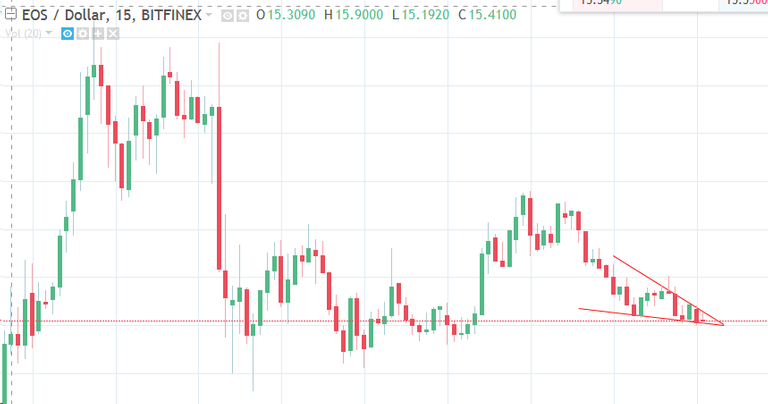
you people are out of your fucking mind. Just draw random triangles and hope it goes up at some point...
Only sometimes, I'm hoping it goes down if I have a short position on it.