Bitcoin Cash Price Analysis
I decided to do an analysis on Bitcoin Cash, because it's one of the top 5 coins and it's one that we talk about the least probably out of all of them (minus the constant Roger Ver hate).
So, let's check it out in full here:
Bitcoin Price Analysis
https://www.tradingview.com/x/Xux2kC4U/
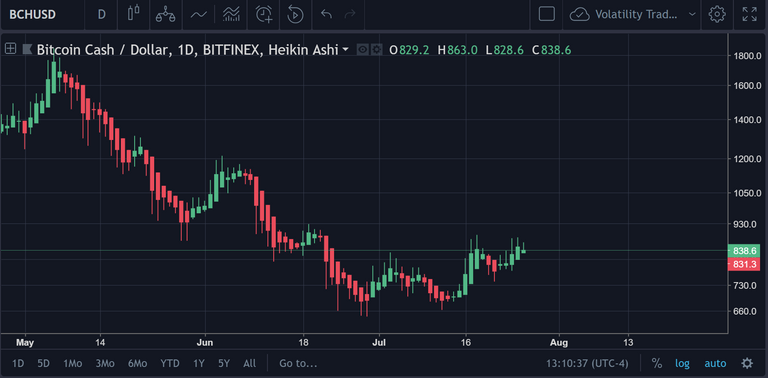
This is the Basic Chart for Bitcoin Cash on the Daily Chart.
Now, here's the next thing that I'm checking out on the daily:
https://www.tradingview.com/x/gnAOeT04/
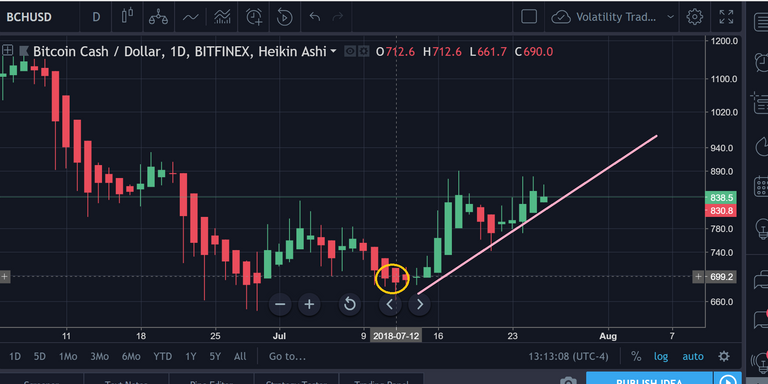
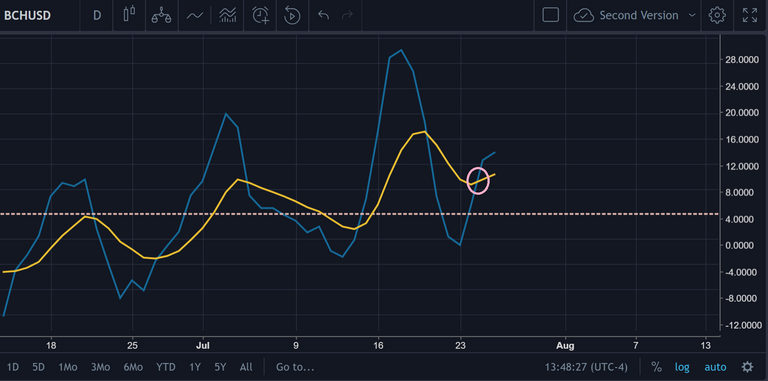
The price action changed directions to a minor uptrend on the daily from July 11th/12th.
This is the downtrend from May 6th (so, this lasted longer than it did for Bitcoin and other cryptos in the Top 5).
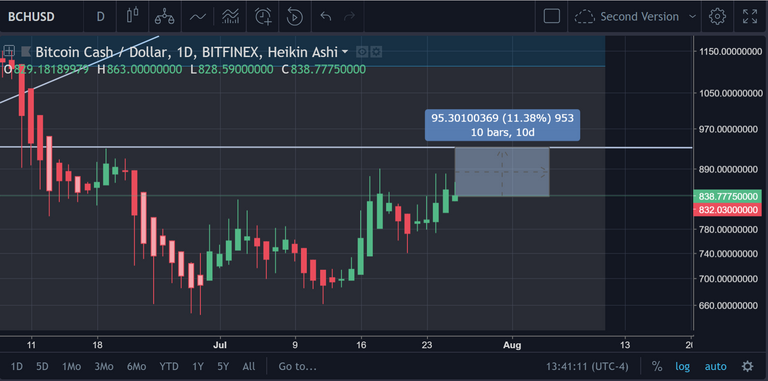
https://www.tradingview.com/x/43iqMFAz/
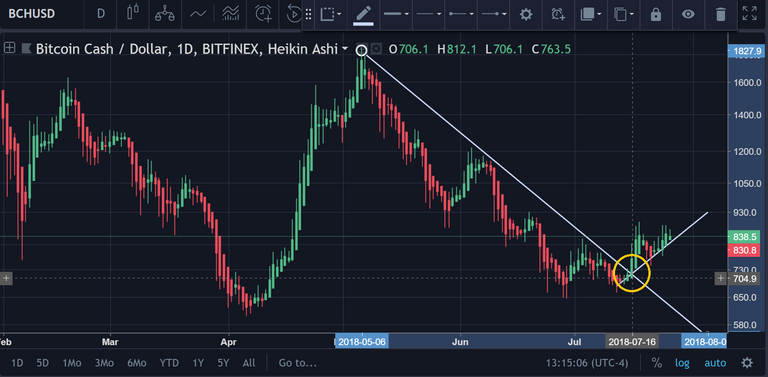
Double-Bottom Chart Pattern
The turning point here to break out of that trend was on July 16th. Definitively.
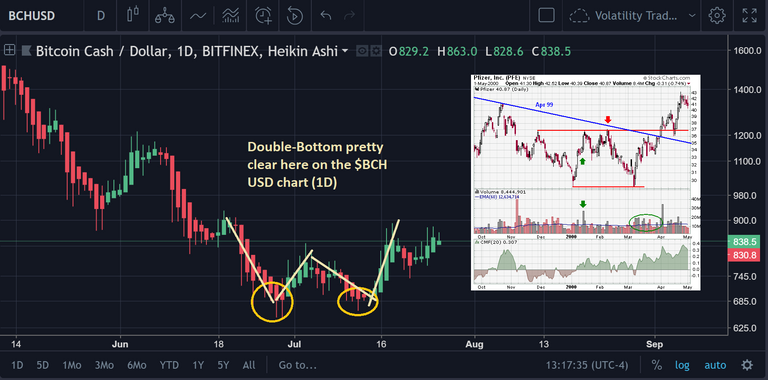
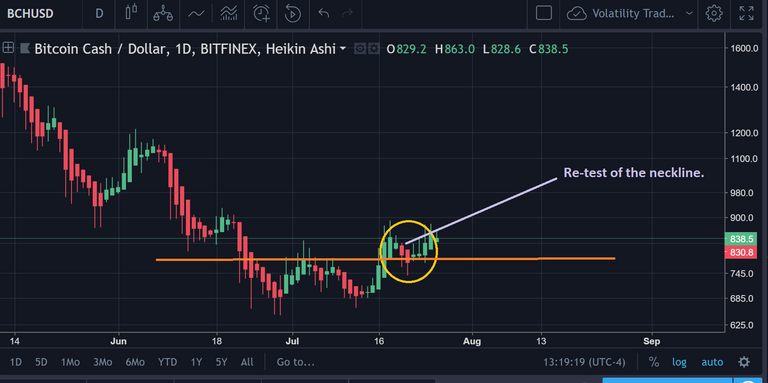
So, the double-bottom pattern that formed on the 1D chart is fairly obvious at this point.
It appears as though the re-test of the neckline has already occurred as well.
https://www.tradingview.com/x/wRq5ZmqS/
So, based on what we know about the double-bottom pattern (from this article that I wrote on it):
https://steemit.com/bitcoin/@cryptomedication/how-to-trade-the-double-bottom'
So, let's calculate the gains that the double-bottom pattern predicts that we should be seeing.

https://www.tradingview.com/x/UlHxB9Bm/
So, the price at the neckline = $789.
The distance between the neckline and the bottom of the double-bottom formation = $121 (as shown above by the rectangular box).
In order to find out the 'target price' for the completion of the pattern, we add the two values above.
So, $789+$121 = $910
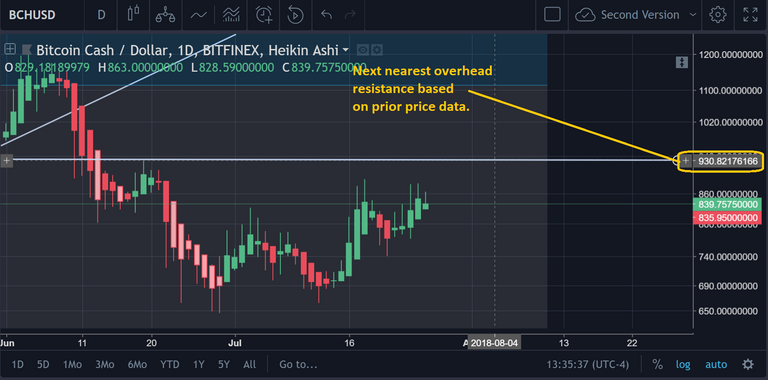
Resistance Points From the Chart
https://www.tradingview.com/x/Et8a2UWu/
Coincidentally, the next nearest overhead resistance on the chart rests at $930.
However, there is one intermediate resistance that the price is currently sitting at as we speak.
Check it out below:
Fibonacci Chart
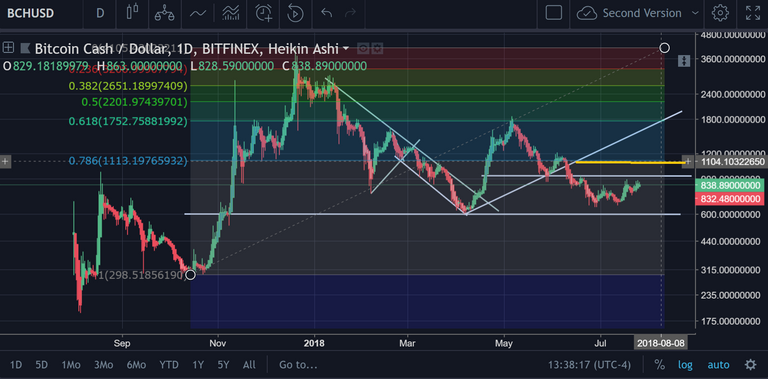
https://www.tradingview.com/x/QE257xp3/
The 78.6% retracement point for $BCH is hovering at $1104 as well.
In All Reality $BCH is a Complete Gamble Right Now
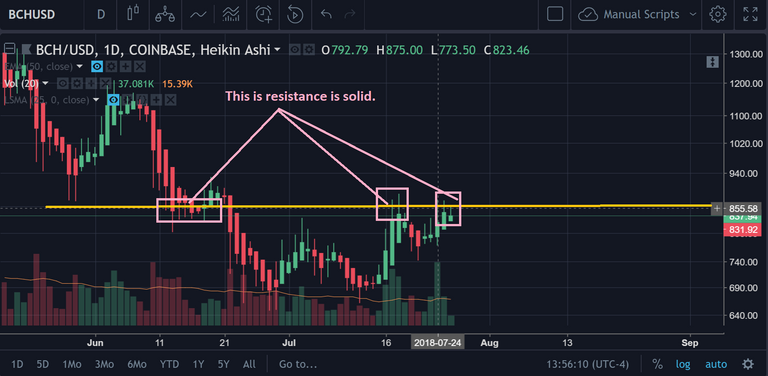
The reason that I say this is because of the vast difference in price between potential resistance/support points on the daily chart.
For instance, there's an overhead resistance at $930 (as mentioned above), which constitutes a solid gain of approximately 11%.

https://www.tradingview.com/x/Z180crNH/
However, there is an even more precipitous drop that could occur if it were to teeter overboard (Bitcoin is very overbought right now on the markets). If the markets were to face a pretty serious consolidation in the next few days, then that could signal some major trouble for $BCH.
The downside is very steep from where it's at currently.
https://www.tradingview.com/x/roKPSWdA/
A mere drop from the current price down to that double-bottom support means a depreciation of 20%, which is fairly vicious.
If we look at the long-term 'bottom' support for 2018, then that price drop is even more precipitous.
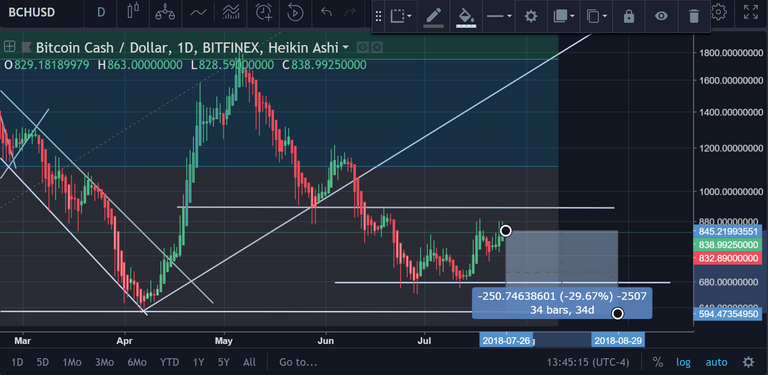
https://www.tradingview.com/x/Ryz17OBg/
A visit back down to that support at $600 would represent a total loss of 30%.
This is important to note because its a possible scenario if things don't go right.
Relative Strength Index (14)
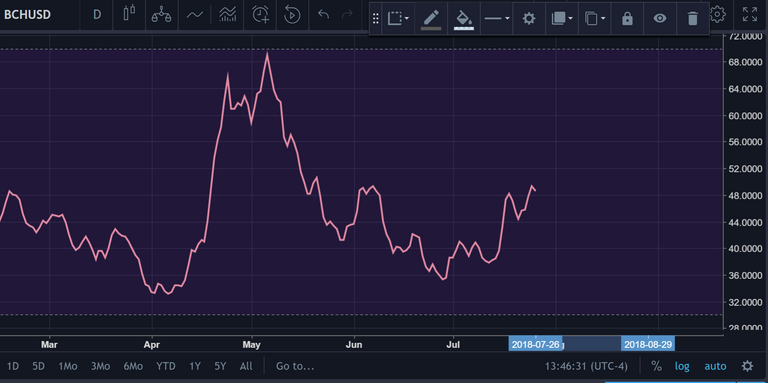
https://www.tradingview.com/x/s5Le53oh/
Admittedly, though, the Relative Strength Index looks pretty damn good from where I'm standing.
There's definitely a lot of room to grow on the daily from what I'm seeing, and no strong divergence to indicate that the price is looking to topple over or enter into a fairly heavy period of consolidation. This is positive news for $BCH.

Rate of Change of the RSI(14)
https://www.tradingview.com/x/U4zEPqtU/
I won't get too deep into those two lines above since I've already covered it like a million times already, but this cross of the Rate of Change of the RSI(14) over the EMA(9) of that same value = bullish/buy signal.
Not saying to 'buy' off of that indicator alone, but it's definitely something to consider here.
Looks like there's a lot of room to grow and positive momentum behind $BCH as well.
Let's see what the Balance of Power has to say
Balance of Power

https://www.tradingview.com/x/uPlKLlb9/
This isn't a normal 'Balance of Power' indicator that you're probably used to seeing on TV.
What I did was apply the RSI(14) to this indicator, and then I smoothed that RSI value over with an EMA(50).
Pretty easy and it has yielded an extremely effective strategy.
CryptoMedication Volatility RSI
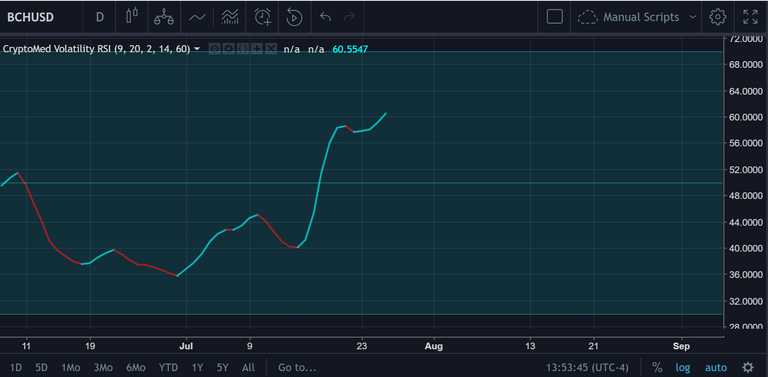
https://www.tradingview.com/x/r382r4pA/
Strategical Planning for the Trade / Conclusion
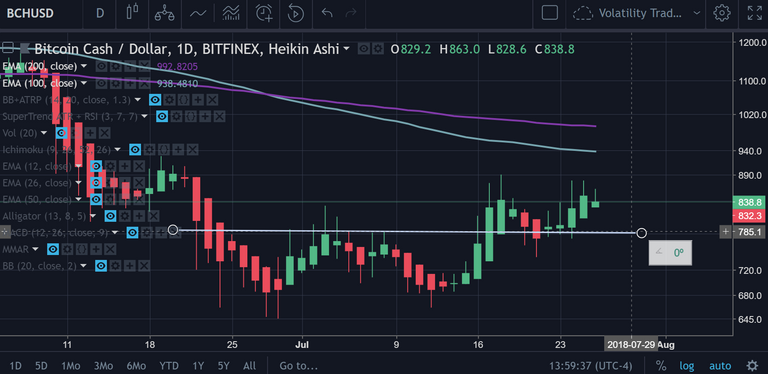
https://www.tradingview.com/x/uDf3A8ws/
As stated before, this entry (on either side of the trade) feels like a gamble.
I could justify the price headed toward $787, but I could also justify it going to $930-940.
Thus, my outlook on this trade = Neutral.