Represented is my 1st trade chart tracking the current state of Bitcoin!
This is on a 1 day scale and 1 yr chart.
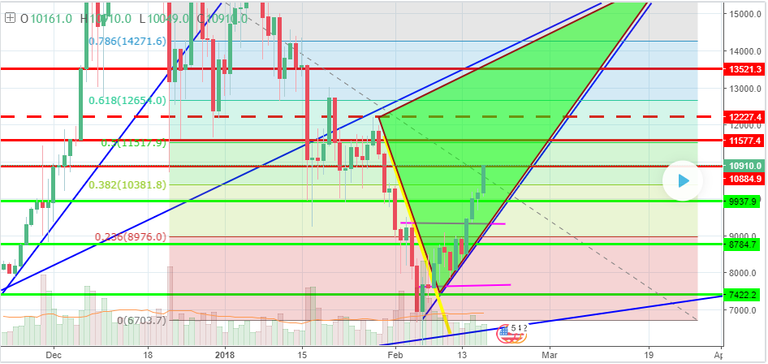
To help identify the color lines are as follows:
Red = Resistant Lines
Green = Support Lines
Blue = Upward Trend Lines
Yellow = Downward Trend Lines
Red Dotted = Critical Potential Upward Trend Line (My Opinion)
Green Triangle = Bull Flag
The oldest Upward trend line (blue) is started on 6/7/17 and the newest occurring 2/6/18.
BTC 7.55% is showing Bullish activity that could boast a strong upward trend that could start to see major resistance around or before 16,578.
I marked 3 resistance points before the 16.5 mark. Based on two factors.
1.) The Doted Red Line @ 12,227 = This represents the last high point on 1/29/18
2.) The 10,884, 11,577 and 13,521 are past Support Lines that became Resistant Lines, and are the current resistant points in this bull flag .
Currently there is a wall of sellers at the $11,000 dollar mark (seen on gdax).
This looks like the reason why the 10,884 point is stuck still in Red as a resistant point.
It will most likely fluctuate between this until it eventually breaks $11,000 soon.
$12,227 is in my opinion a major point to know if this trend will continue.
If it breaks this point it will recover it's last major point before the fall on 1/28/18.
This could be a good sign to breaking the resistant at 13,521 and fast track to the major sell off
that happened with panic sellers at the 16,580 mark!
Let me know what you think and ANY POINTERS to help me get better!
Peace
Nice post! I will follow you from now on. +UP