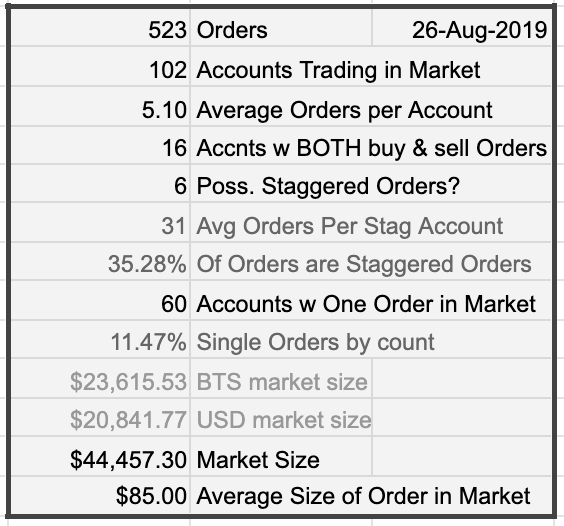
So let’s take a look at the market of BTS and bitUSD. This market has an 101 accounts with 521 orders. The average order is size is about $85. A $500 USD buy or sell order will instantly fill within 1.2% of the market mid price.
The BitUSD market was much more liquid before BitUSD went through global settlement. Liquidity dropped dramatically last year. This market used to be the biggest Smart Coin Market on BitShares, but now BitCNY has that spot.
Currently, the price midpoint is 0.0395 USD for one BTS
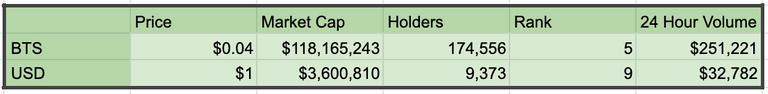
This market is made up of two assets.
The first asset is BTS which had a recent price of $0.04314 and had a market capitalization of $118,165,243 with 174,556 accounts or people holding it. This market was ranked 5th on activity based on a 24 hour trading volume of $251,221 on a recent day.
The second asset is USD which had a recent price of $1 had a market capitalization of $3,600,810 with 9,373 accounts or people holding it. This market was ranked 9th on activity based on a 24 hour trading volume of $32,782.
Generally, these numbers need to be taken with a grain of salt. The account numbers can include everyone who ever traded an asset and may need to be reduced by about 80 to 95% in order to get close to actual holders today.
So let’s take a look at up to the top 300 orders on both sides of the market.
There are 223 buy orders.
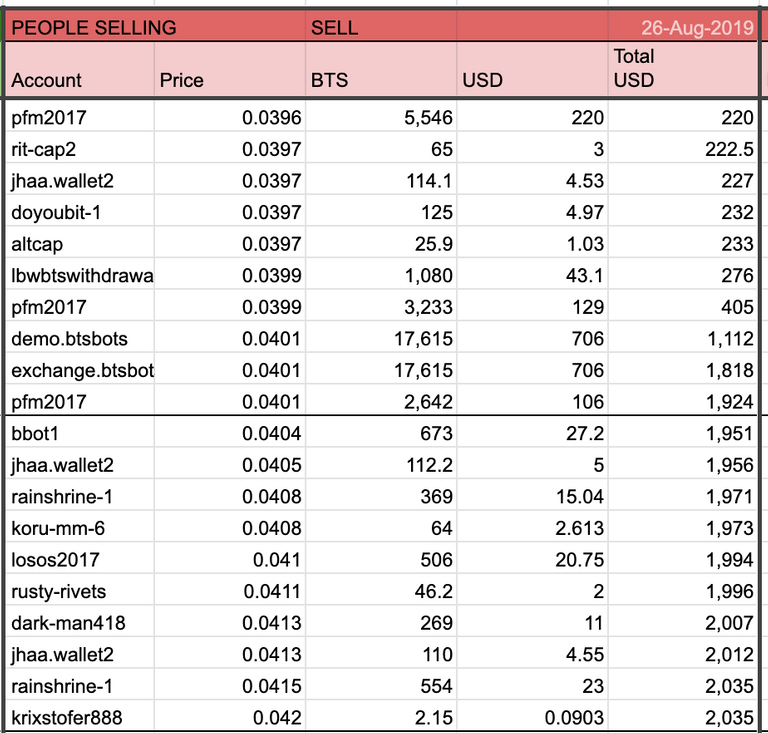
There are 300 sell orders.
This is all the orders.
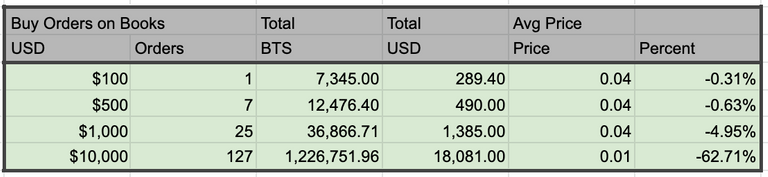
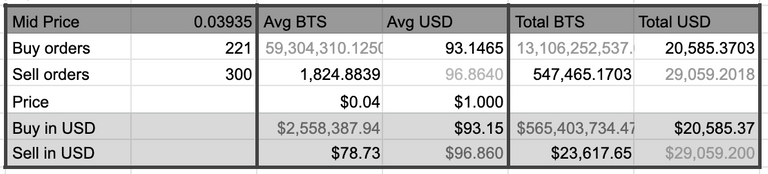 The total buy amount is 13,106,256,732 BTS and $20,841 USD
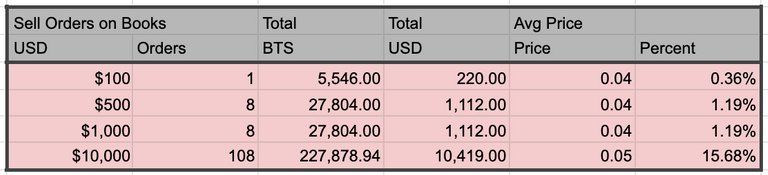
The total sell amount is 547,416.1703 BTS and 29,057.2018 USD
The Average Buy order is for 58,772,451 BTS worth about $2,535,443.
Yep, These numbers are completely blown out of proportion by some "optimistic" buy orders. There are some very large buy orders on the books that throw everything out of whack.
This is why I look at the numbers so precisely and in so many different ways.
The average sell order is for 1,824. worth $78.72
In total on the buy side there is about $565,403,915.45
In total on the sell side there is $23,615.53
So some accounts have multiple orders in them
We are looking at 223 buy orders and 300 sell orders for a total of 523 orders.
There are only 102 accounts trading in this market
That means each account on average has 5.1 orders.
So let's take a look at what would happen if you wanted to sell.
Here are a few of the orders on the order book.
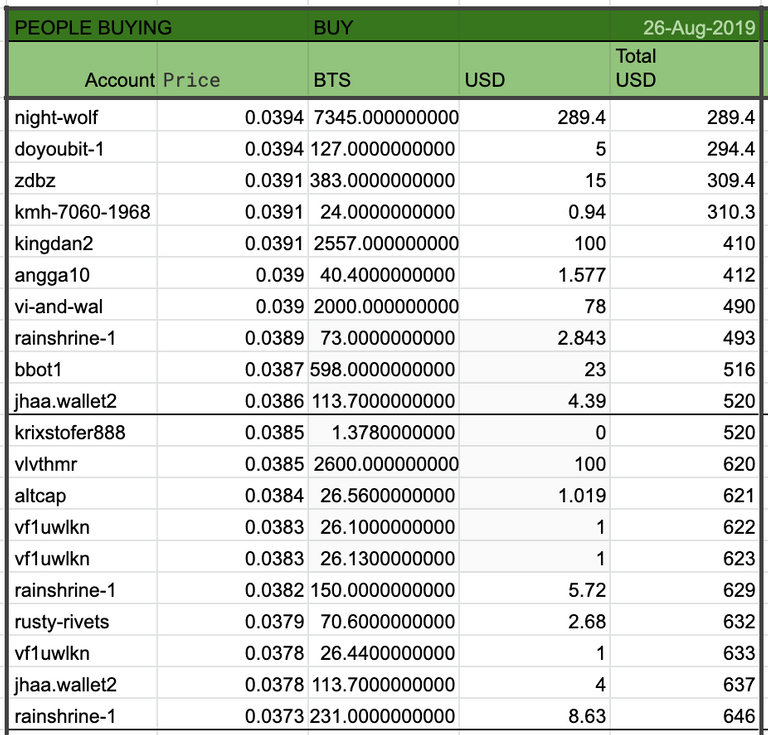 Account night-wolf will sell you 7345 BTS for 289.4 USD at a price of 0.0394.
Account doyoubit-1 will sell you 127 BTS for 5 USD at a price of 0.0394.
Account zdbz will sell you 383 BTS for 15 USD at a price of 0.0391.
Account kmh-7060-1968 will sell you 24 BTS for 0.94 USD at a price of 0.0391.
Account kingdan2 will sell you 2557 BTS for 100 USD at a price of 0.0391.
Account angga10 will sell you 40.4 BTS for 1.577 USD at a price of 0.039.
Account vi-and-wal will sell you 2000 BTS for 78 USD at a price of 0.039.
Account rainshrine-1 will sell you 73 BTS for 2.843 USD at a price of 0.0389.
Account bbot1 will sell you 598 BTS for 23.1 USD at a price of 0.0387.
Account jhaa.wallet2 will sell you 113.7 BTS for 4.39 USD at a price of 0.0386.
In order to get a little better understanding and a little fairer prices, let's assume you buy or sell taking the top 10 orders currently out there on the order book.
We will look at the orders 10 at a time to get a little better understanding of liquidity, size and price that is available.
For the first 10 buy orders out there, 1,326.11 BTS for 52.02 USD or about $57.20.
For the second 10 buy orders out there, 327.19 BTS for 12.54 USD or about $14.11.
For the first 20 to 30th buy orders out there, 2,535.89 BTS for 91.92 USD or about $109.3982946.
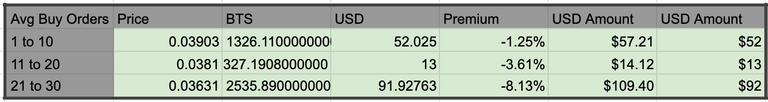
The above sentences might be driving a few people nuts. I have two USD values in the same sentence. Well, you can be driven nuts. My format for this report has slightly different values for BTS, because BTS has moved. And if I spent all my time updating these numbers, I would drive myself and others nuts and nothing would get done. The point here is to evaluate market depth, and by looking at it, in groups of 10 orders we have a concise idea on how big the orders are. I think it is significant that the second group of ten orders only has about $14 each in them. This is lower priced orders, the result of bots with less money, while the at the money bots have slightly more money, Now whether the second group or orders should be valued at 12.54 or 14.11 is not really important. Details such as that, detract from the ability to get a big picture understanding of the market. Generally, there has been limited understanding on the markets as a whole, so any reporting that can get people to really understand these markets is crucial. Only with a good general understanding do get to move on to more precise and interesting data.
If you wish to buy immediately and you took the top sell orders on the book this is what it would look like.
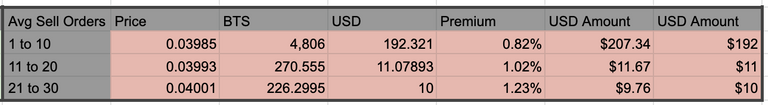
The first 10 sell orders offer up an average of 4,806 BTS for 192.32 USD or about $207.34.
The second 10 sell orders offer up an average of 270 BTS for 11.07 USD or about $11.67.
The 20th to 30th 10 sell orders offer up an average of 226 BTS for 9.59 USD or about $9.76.
Details
So these reports are brought to you by Cryptick who is involved in the BitShares DEXbot Project.
BitShares is an exciting decentralized Block Chain Based Exchange.
Being Decentralized, things just sort of happen, people step up and do things as need may be.
These statistics are believed to be true, but there is probably some miscalculations in them please forgive me.
If you see a problem with the statistics let me know and I will try to hunt down the offending formula and calculations.
Most of the data in these reports comes from Cryptofresh.com, a BitShares blockchain explorer.
The main purpose of these reports is to help people understand the liquidity on the BitShares markets.
I suppose I should also point out that that margin wall does not show in my data. This is a known bug in the data source. Obviously when one is buying into the margin wall, there will be a lot more liquidity.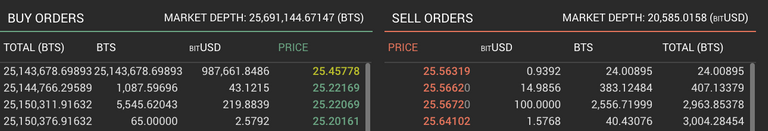
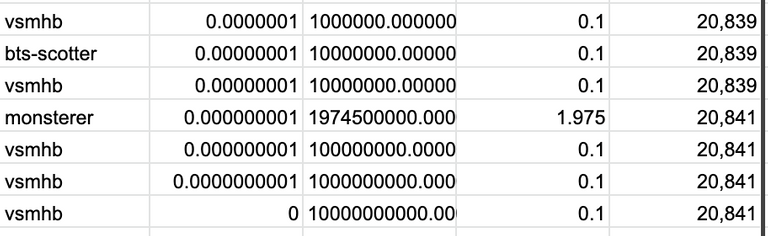
Oh and one more detail, so this market had what appeared to be several staggered orders bots that were outside of the range, with all orders on one side of the market. My current formula requires multiple orders on both sides of the market to count and suspect it is a staggered orders bot, that said it explains some of the difference in the Singles orders being 11% and staggered orders being 35% of the market. One also can calculate that 15 accounts with both buy and sell orders makes up 30 orders or 6% of the market. Some of which would be included in the staggered orders number. Analysis of this type is never precise, but one can get a good feeling of what is going on in the market.