Hi John,
Made some charts of the data i have.
As for #1 that is expressed in the first chart "Smartcoin issuance chart showing weekly change since the start of 2017" although not a line chart it provides the total market cap and also a break down of the smartcoins that make up that weeks total.
Chart #1 - Expressed on a line chart
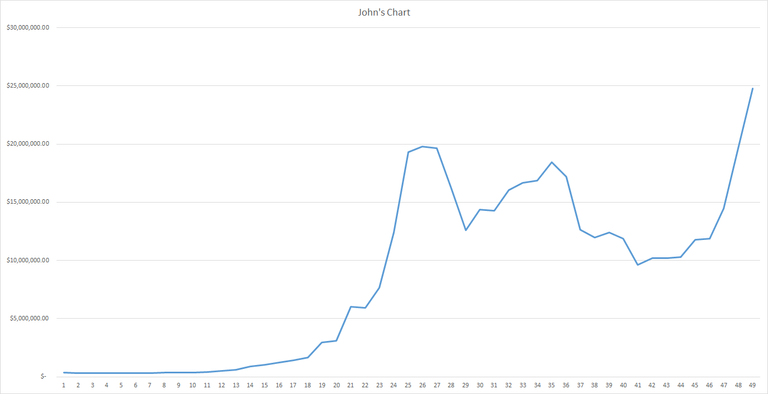
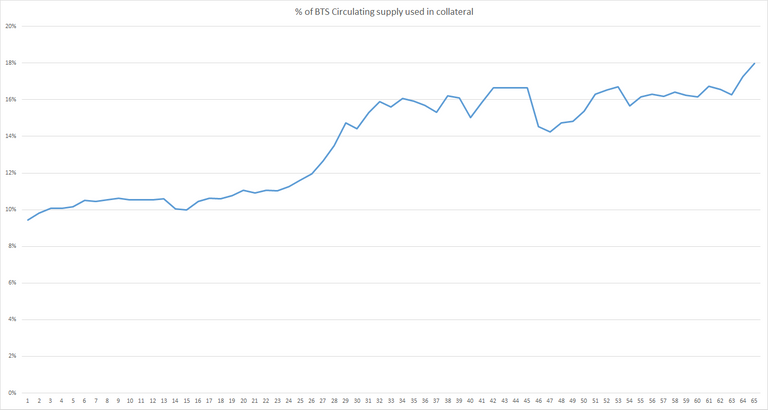
Chart #2 - Total % of BTS used as collateral to back smartcoins
Great read overall! Thanks for sharing! Looking forward to hearing more of your thoughts on the crypto markets!
https://steemit.com/bitcoin/@college-is-dumb/bitcoin-crash-sunday-bitcoin-overpriced-investment-banks-manipulating-futures

https://steemit.com/bitcoin/@college-is-dumb/bitcoin-crash-sunday-bitcoin-overpriced-investment-banks-manipulating-futures
This is absolutely amazing! Thank you! Any chance you can include in future editions of the SotN? Holy crap that trend is exciting for Bitshares - those charts may well become some of the most important ways to visualize the growth of Bitshares!