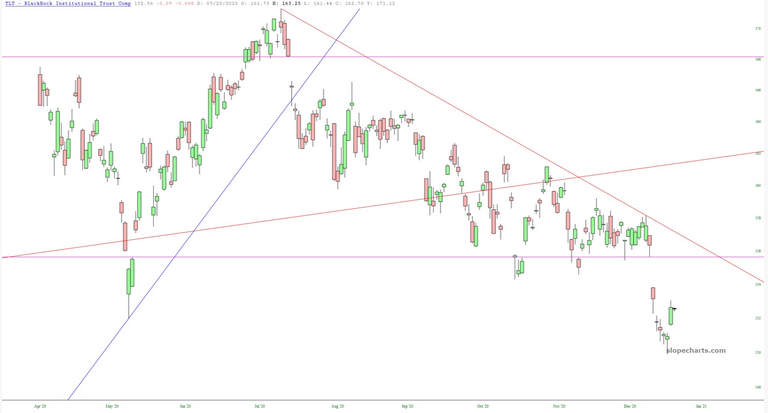
US bonds have been breaking down for about a year now, and although there will be small bounces along the way, the pattern is fairly clear. The next meaningful resistance is the price gap on
TLT at 155.66:
TLT Chart  TLT Chart
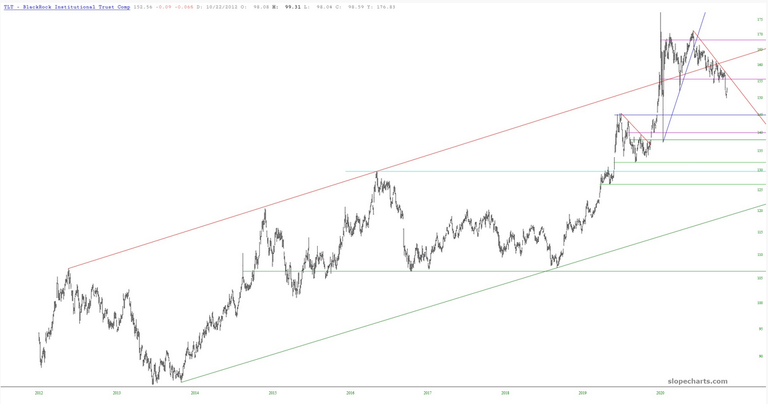
Looking at the longer-term picture, you can see the long-term channel defining the uptrend. There’s a long, long way to go down, even if it’s merely to connect with the lower bound of this channel once more. The message is: don’t be surprised at markedly higher interest rates in the years ahead.
TLT Chart  TLT Chart