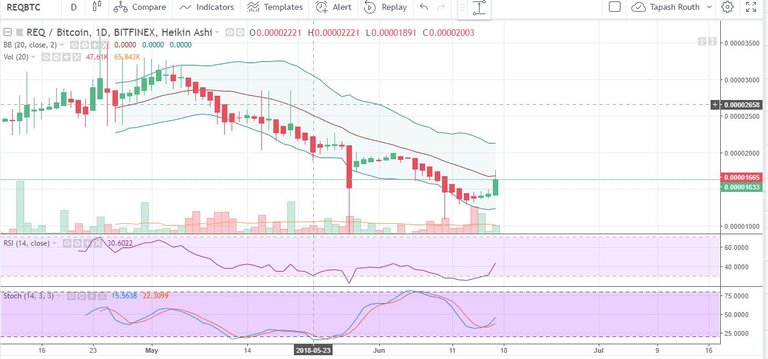
Hello Friends here I am taking 1 day char for long term As you know REQ has reached it’s all time high in back January 2018 almost 1.07$ or 6497 Satoshi and now it’s trading on 0.108 or 1656 Satoshi But After 6 months of downtrend, it bounced when it hit OVERSOLD in RSI (Relative Strength Index), with positive signals and now I think it’s ready for another pump.
As I believe it’s a low risk coin with huge potential in the red market.
Request Network (REQ) Trade Analysis by Tapash Routh
CHARTS, SIGNALS ,VOLUME & INDICATORS
First this we need to understand that Lower Bollinger bands it’s green candle starting with away and that’s the signal to us to buy
Secondly RSI just crossed the bottom line and this is the second signal to buy it might go lower but chances are less
Third thing is Stochastic is showing that that blue line is above than that red line and this is Bullish Signal
Volume is also increasing
Disclaimer- Hello Friends this is my personal point of view so if you are looking for investment decisions. First of all try to research by your own and until then you are investing then I am not responsible for any of your benefit or losses and after reading this post you should admit and accept that
Good work keep doing this regular we got help from your posts information
Thanks for the detailed information.
nice info
follow me bhy