
The world's largest capitalized electronic currency has witnessed a trading day yesterday (January 8) with price movements taking place both up and down, before closing the day (in UTC time) at $ 3,995 on Bitstamp.
Basically, the BTC yesterday formed a doji candle, which is often seen as a sign of a lack of a clear trend in the market, although the appearance of the bull flag has made way for the price to rise. $ 4,200.
Worse, this doji candle may have formed at the top of the rally this week and stopped at the resistance level of $ 4,100, signaling that the momentum has no longer been motivated.
The trend of devaluation, therefore, may soon return, especially when the hesitation on the market at the moment cannot help Bitcoin keep itself above yesterday's low of $ 3,934.
Graph the day candle of Bitcoin price
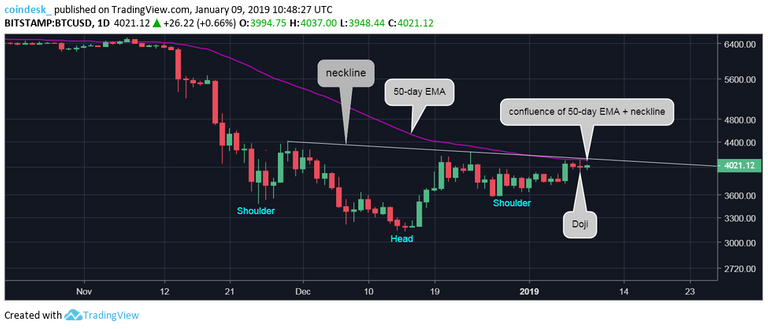
As can be seen, the BTC has formed a red doji candle right below the 50-day moving average (EMA) and the neckline resistance level of head and shoulders.
The probability of a price breakout above $ 4,130 - the price range just has the 50-day EMA - will decline significantly if Bitcoin confirms a reversal of the price trend with a doji candle with today's candlestick below $ 3,934. This may make the long-term decline scenario rise and pose a risk of Bitcoin being trampled to $ 3,566 (December 27 bottom).
Remember that a fall to $ 3,566 will also replace the confirmation that the head and shoulders have been broken, likely to cause pessimistic psychology to spread.
Simply put, BTC's upward momentum needs to do something soon. If the day candle is above $ 4,130, then there is still a chance of a pattern reversal to turn the head and shoulders and open the door for a rally to higher prices.
4-hour candlestick chart of Bitcoin price
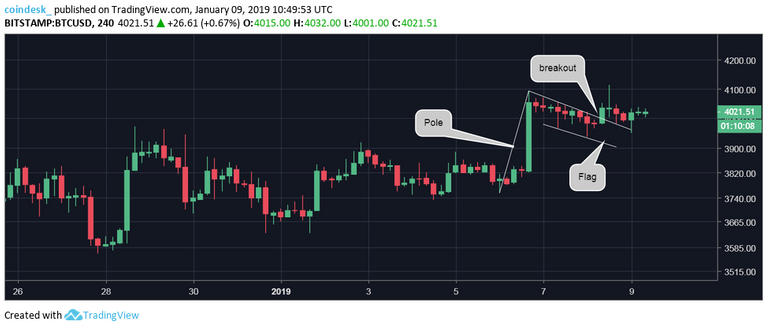
Bitcoin has recorded an increase in the flag on the 4-hour chart, signaling the continuation of the rally from the bottom on January 6 is $ 3,753.
However, until now, the price has not been able to achieve much progress because there is still a resistance level of $ 4,130 neckline lying ahead. However, the bull flag pattern is still fulfilled and will only be crushed if the BTC drops below the previous low of $ 3,934.
Identify
• The shortfall of Bitcoin price at the strategic resistance of $ 4,100 may cause the trend to decline again.
• If the BTC closed today (in UTC time) below $ 3,934, there is a high probability that a reduction of $ 3,566 will result. If this support level is also penetrated, the bottom pattern will be gradually higher and cause the price to face the risk of continuing to fall to the December bottom of $ 3,122.
• In the opposite direction, $ 4,130 continues to be the target for Bitcoin to conquer as soon as possible. If the head and shoulders shape is completed, it will disable the red doji candle yesterday and create momentum to recover the $ 5,000 important psychological threshold.
Congratulations @dinhanhuy! You have completed the following achievement on the Steem blockchain and have been rewarded with new badge(s) :
Click here to view your Board
If you no longer want to receive notifications, reply to this comment with the word
STOPDo not miss the last post from @steemitboard:
Thanks Steemit!
Hope i can earn more