BTC continues the upmove which means my wave b count was obviously wrong. No biggie, it happens.
For my next count update, I want to see more price data first, because there are a few things possible right now.
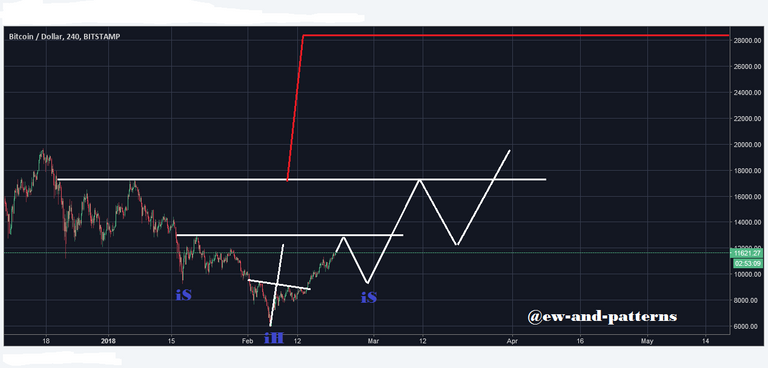
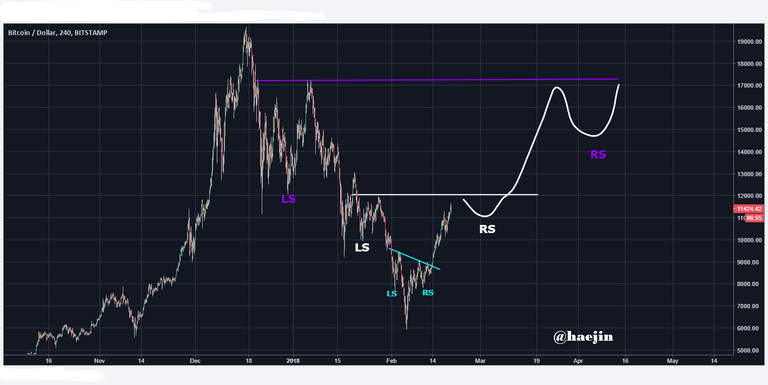
But I don't want to leave you hanging without a chart today. haejin posted a superb chart for forward discernment today, which I want to talk about. It shows several nested iSHS patterns. The necklines are right at the strong resistance levels which increases probability of this chart pattern unfolding.
This is my version of his chart pattern idea:
And here is @haejin version of this chart, which inspired me to make this post:
I really think this could be happening. The target would be 28,000$ BTC... Stay tuned...
.png)
If you think this to be useful information:

Feel free to use and share my charts, but please mention me, @ew-and-patterns as the author. Otherwise it is considered plagiarism and I will flag you and advise my friends to do the same.
MUST READ!
DISCLAIMER: This post / analysis serves general information purposes only. I am not, and never will be a financial adviser. The material in this post does not constitute any trading advice whatsoever. This is just the way I see the charts and what my trading ideas (from my personal experiences) are. I use chart pattern and Elliott Wave analysis for my trading ideas.
For full disclosure: The author of this post is holding positions in this market at the time of this post. Please conduct your own due diligence, if you plan to copy anyones investment decisions!
If you make any trades or investments after reading this post, it is completely in your own responsibility. I am not responsible for any of your losses. By reading this post you acknowledge and accept to never hold me accountable for any of your losses.
Please consider leaving a comment, like or resteem, if this post entertained you or helped you see things differently...
Have a nice day :-)
As per your chart the expected time of reaching that 28000 mark is April. Well I also want that bitcoin should break ATH in March but I doubt it would happen because we might struck with some sudden FUD is market.
I want it to wait till April as it’s a new tax year and I can convert more of my gains!!
On this Thursday btc is gonna down. So wait for the dip and buy there.
Sounds awesome. Let’s hope it comes off. 28k btc would be great. I truly believe that we are in a much better position now than we were this time last year with so many more able to access crypto. When we really start to move we will really move
At this rate, should hit $12,000 before the end of the week.
Only run up !
Bitcoin gonna come back to 4200. We cant break the trendline with this volume. Check my analysis here.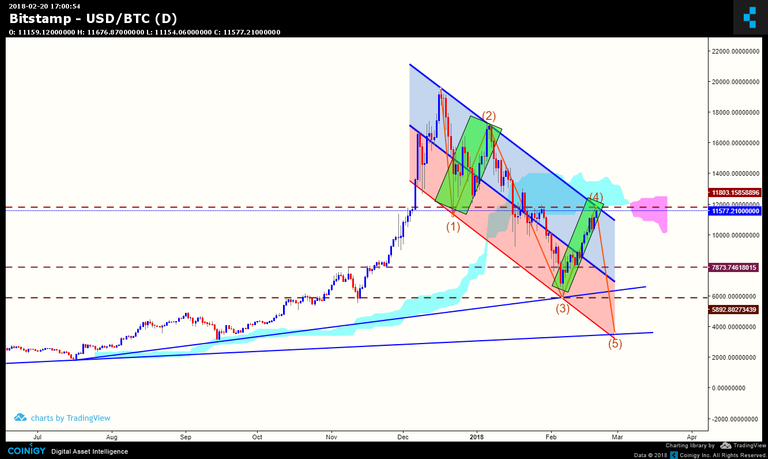
https://steemit.com/bitcoin/@mazharkazmi/bitcoin-warning-usd12000-and-then-usd4200
Yes we can't break it first try. But that does not mean a new low is coming...
The small iSHS becoming superlative, amazing
Still too eary to tell but it seems that the market wants to test $12k... Will be inter to see where we go from there and on what volume which will ultimately determine sentiment. Thanks for the TA! Also, the posts here are great! They help provide perspectives.
If you actually draw a line through all the the shoulder points. That would make a perfect long time cup and then handle should form? No lol.
2 hours before @haejin i investigate same inverted SHS scenario (read more here @) but haejin develop this idea into bigger symmetry. It's looking interesting but reability decreases with time. Many things can change this scenario still.