Simplicity is trump!
Sometimes simple things are more effective. And when it comes to bitcoin charts there are a many ways charts can be analyzed.
For me keeping it simple and focus on the main thing is always key. To that end there are two things that are overwhelming this year:
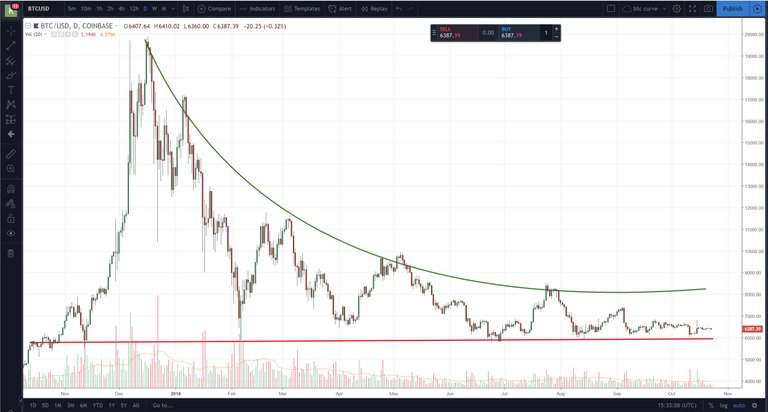
2018 is the year of 6k+
In the beginning of the year bitcoin immediately crashed toward 6k and almost touched it for like a nanosecond before rallying back up and doing this over about 6 times so far.
About one year ago is when we breached 6k for the first time. Now we have come back to the same level and are holding very still.
The breakout seems all but certain
I cannot imagine that bitcoin will stay this low in volatility and am sure that a breakout will happen one way or another.
In the past, these low volatility spots came in times of bottoms. I remember in 2015 similar low volatility and boring bitcoin times.
High to low volatitly
We went this year from extreme volatility to the most boring asset when it comes to volatility. So bitcoin has done this curve or 1/2 circle.
looking for the other side of the circle.
As a perma bull, I tend to see the upside. That upside means the other side of this circle could be upon us.
However, I feel that 6k is still fairly high and a crash as Tone Vays predicts towards 1k is also very likely. As a result, like the market I am frozen in my action waiting for the breakout one way or another.
Join the Club!
We have built a new service that will help you get upvotes using your own SteemPower.
![]()
Or you can sign up here: https://steem-bounty.com/services/vote-club
Please vote for our Witness
Thank you very much for your attention and we hope you will vote for us as witness!
In order to do so you can go to:
https://steemit.com/~witnesses 
And enter the "steem-bounty" account into the text field and click vote.
Or use steem-connect to vote directly for us as Steem witness!
I agree simple charts where you can see the relevant price points is best for orientation.
For Bitcoin the cards are still wide open...we could see a fast "fake" move to the downside so that all Bitcoin 5000$ boys get their buy orders filled and are happy. Than after that move we would see a rapid pullback to the previous highs.
If we don't see the 5000$ price again...oh boy those investors who where patiently waiting for it, they will all have to buy Bitcoin at higher price and chase the move upwards...and FOMO starts all over again.
I'm very curious about how this is going to play out!!!
Same here
Posted using Partiko Android
Congratulations @knircky! You have completed the following achievement on the Steem blockchain and have been rewarded with new badge(s) :
Click on the badge to view your Board of Honor.
If you no longer want to receive notifications, reply to this comment with the word
STOPDo not miss the last post from @steemitboard:
Ready to take off!
Posted using Partiko Android
Great analysis sir

Shared on twitter