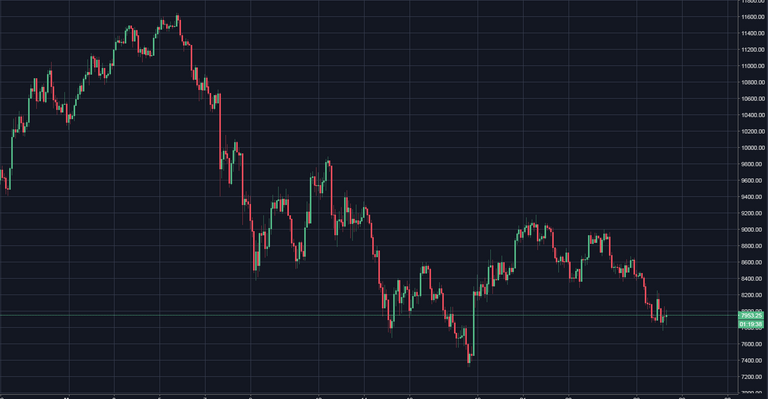
Bitcoin price fell below $8k yesterday and, despite briefly flirting with $8,100 overnight, it has slumped back down to $7,900. As tends to accompany any price drop, a lot of traders are beginning to panic. Many analysts expect a further slip in prices before the situation improves.
Option 1 – The Bullish Option
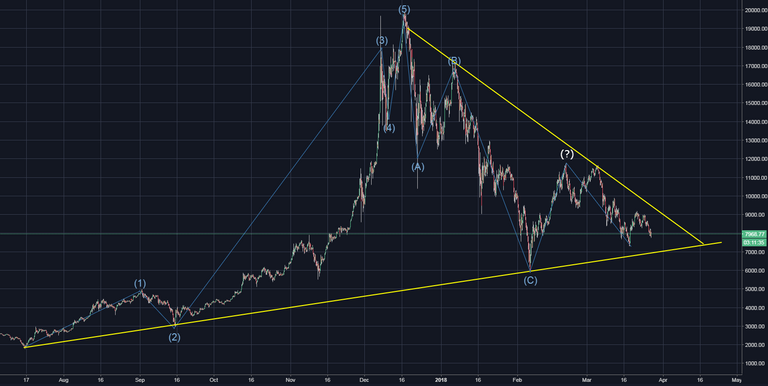
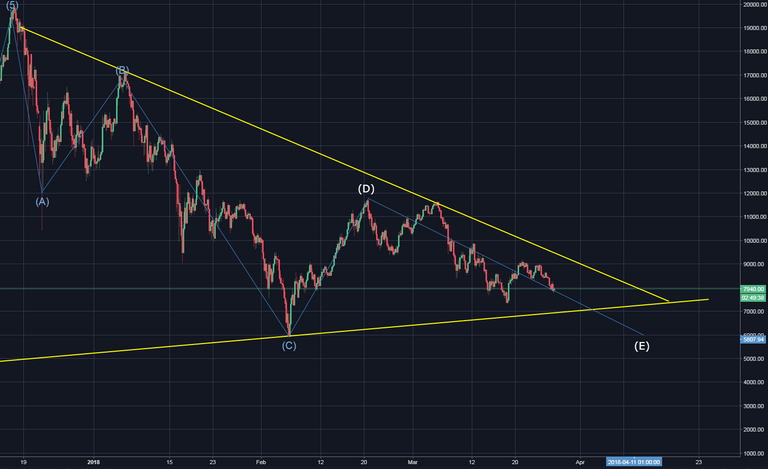
Point C represented a pullback to the .786 FIB retracement level compared to the previous rises. If we assume that the question mark (?) is wave 1, then the dip to $7,300 acts as point 2 and once again retraced to the 0.786 FIB retracement.
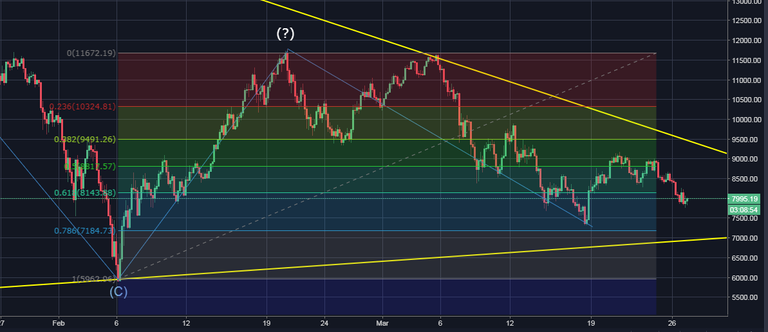
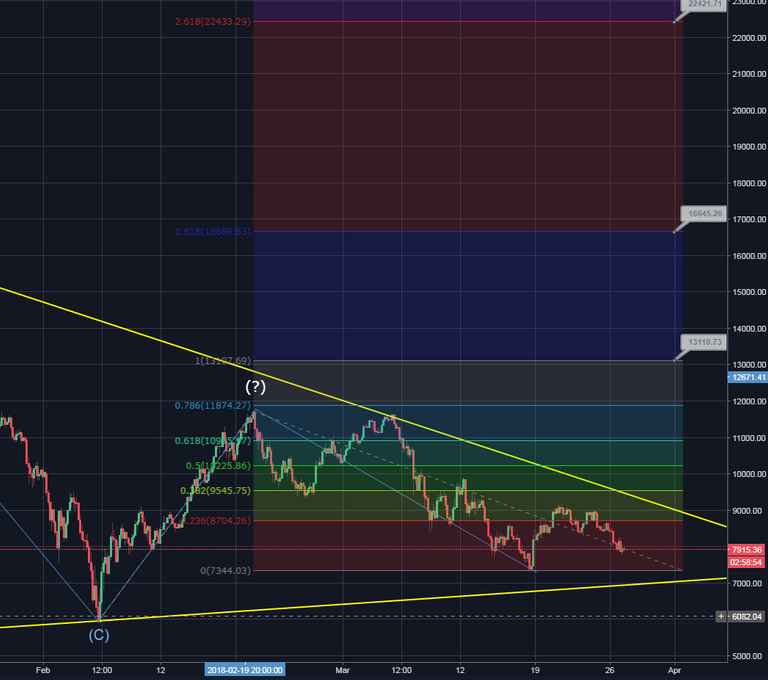
In this case, we can expect a protracted rise to levels above the $11,800 highs that were achieved towards the end of February. Likely levels for the end of wave 3, which could take weeks to complete (so don’t expect it overnight) would be $13,200 if waves 1 and 3 achieve parity – in which case, wave 5 could extend. Alternatively, FIB extensions determine that we could be headed as high as $16,800 or even $22,700.
This is my preferred option, but even following this scenario, there is the chance that prices could correct further down to the $7,100 mark before it really takes off.
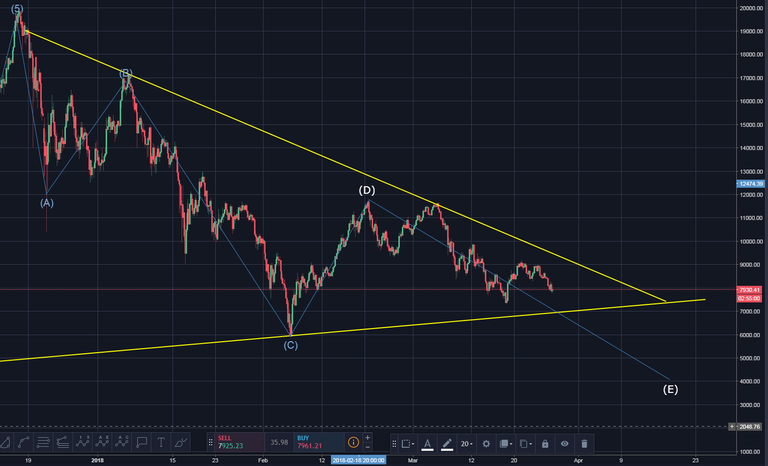
Option 2 – The Bearish Option
Alternatively, point (?) could be point D and further correction to point E would be required. We’ve seen with a number of alt coins recently, that it isn’t unusual for corrections to retrace beyond the 80% level, which means that point E could reasonably drag prices down to $5k or even $4k.
Other Options – The Double Bottom
Another possibility that falls somewhere between the two options above is that of a double bottom forming. This means that the price would slip to form another bottom at around the $6,000 mark.
As ever, we have to keep an eye on price movement and use updated data to find confirmation or, at least, to determine which outcomes looks the most likely.
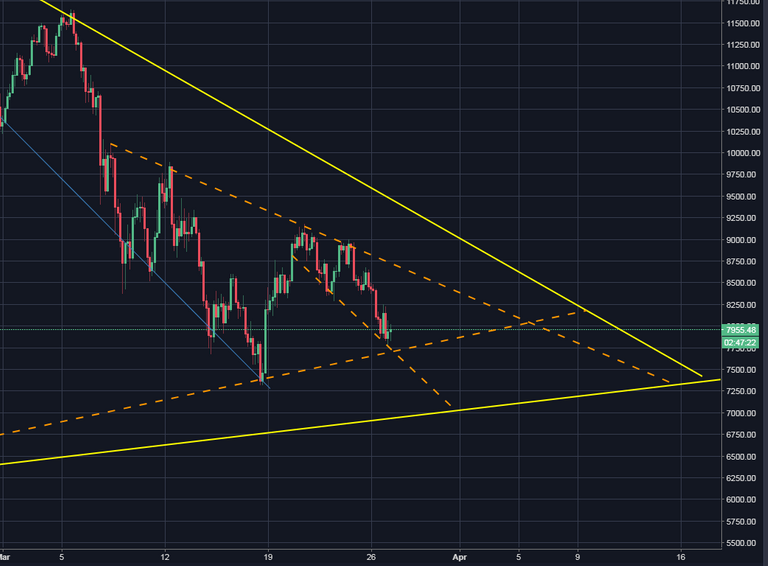
Trend Lines
In terms of trend lines, we have the orange dotted lines, which are shorter term trends. These converge at the beginning of April, by which point I expect BTC to have risen and dipped but remained inside the orange lines. From here, Bitcoin will have to make a move and either break the upper or lower solid yellow trend lines, both of which are long-term trends and will prove difficult to break through.
I’m feeling bullish on Bitcoin, so while we might lose a few hundred more dollars off the price, I believe we’re heading up in the medium term. I don’t expect price to fall far below the $7,100 mark and I expect price to head up to at least $13,200 and to complete wave 3. Time will tell whether wave 3 extends, which is the most common scenario, or reaches parity with wave 1; in which case, we would expect wave 5 to extend.
Time will tell, but I'm bullish on Bitcoin's medium and long term. Are you bearing or bullish?