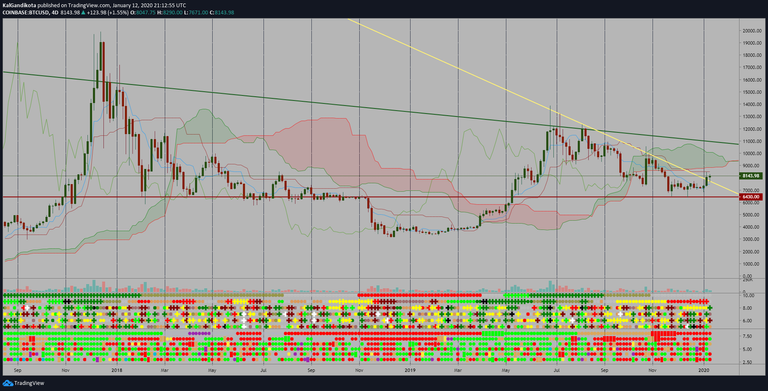
The above chart is 4D BTCUSD used here for convenience. For Entry and Exits, I look at 1D BTCUSD chart. (I do something similar with GLD chart also)
The two lower indicators are from my scripts on tradingview (Kal’s MTF ADX Rangoli Roller, Kal's MTF OBV Haar). Please check them out on my tradingview profile page.( )
- Red/Maroon line is Support. If Bitcoin closes below this line, it’s time to check every day for selling. If Bitcoin’s High price for the day is below this RED/MAROON line or Close of a long red candle crosses down this RED/MAROON line, SELL!
- Yellow line is wait/volatile. Right now(Jan 12 2020), BTC closed above this line. It’s time to WAIT AND WATCH or if stuck to a computer with tradingview BTC chart, one may play 1% profit or loss scalping.
- Green Line is Resistance. If Bitcoin closes above this line, it’s time to check everyday for buying. If Bitcoin’s low price for the day is above this line, one may buy a SMALL portion of their budget(max 20 to 30 percent of their budget, divided 14 parts, one or two parts each day) and wait for 21 days with a stop-loss(you decide). From here, the bitcoin’s price(low or close) may retest the Green line within 21 days as support. Thus, AFTER 21 days of Bitcoin’s Low above Green line,
- If the Low price of the day is above this green line, one may enter with 70 or 80 percent of their budget(divided 4 or 5 parts, one part each day based on your comfort and price level swings)
- Use 50 period daily EMA or your lowest Entry price+commission & daily expenses for stop-loss. (I don't place stop-loss on exchange. I place them as alerts here on tradingview and upon receiving SMS alert, I log into exchange to sell. By doing so, one may avoid huge-losses due to "Candle Wick Stabs")
- I don’t know when to take profits, if you know, please write in the comments section below.
There is a strong resistance to BTC at the Ichimoku Cloud(8500 to 9500). As a small sporadic investor, I won't buy BTC in this cloud zone. I'd stay on sidelines and watch whales swirl here until BTCUSD goes above green line.
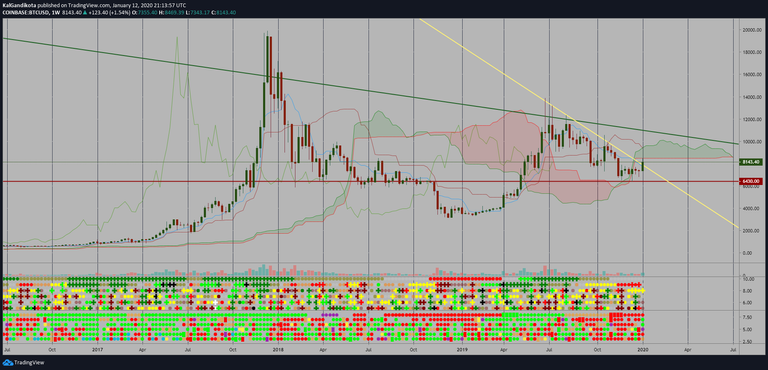
BTCUSD 1WK Chart
Please let me know if I am missing anything.
Safe Trading!
Kal Gandikota
PS1: If you find my postings interesting and edifying please follow, like/favorite/upvote.
PS2: Please kindly donate for my daily expenses (at least as you would on streets):
- BTC Wallet: 1NeDC1GvpFa49DFLuT1v28ohFjqtoWXNQ5
- ETH Wallet: 0x35e557F39A998e7d35dD27c6720C3553e1c65053
- NEO Wallet: AUdiNJDW7boeUyYYNhX86p2T8eWwuELSGr
Also, I’m hard to miss. There is only one person in the entire world with my name.
PS3: For more information on EMA, Stop-loss etc. jargon, please search internet or here yourself.
Legal Disclaimer: I’m in pain & swelling due to disability, therefore am short and precise with this post. I am publishing here so I get replies from fellow viewers for the refinement of algorithm, to educate myself and for my daily expenses. Hence, if anyone uses this post for making their decisions, I am not responsible for any failures incurred.