The OPEN.ETH and BTS market has 64 accounts with 412 orders at an average size of $20.24.
This report continues my look into some market statistics around BitShares.
Liquidity, the ability to buy and sell easily, is an important part of a market.
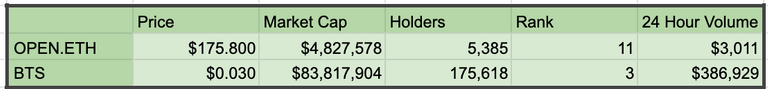
Let's take a look at the markets, it is important to have good perspective.
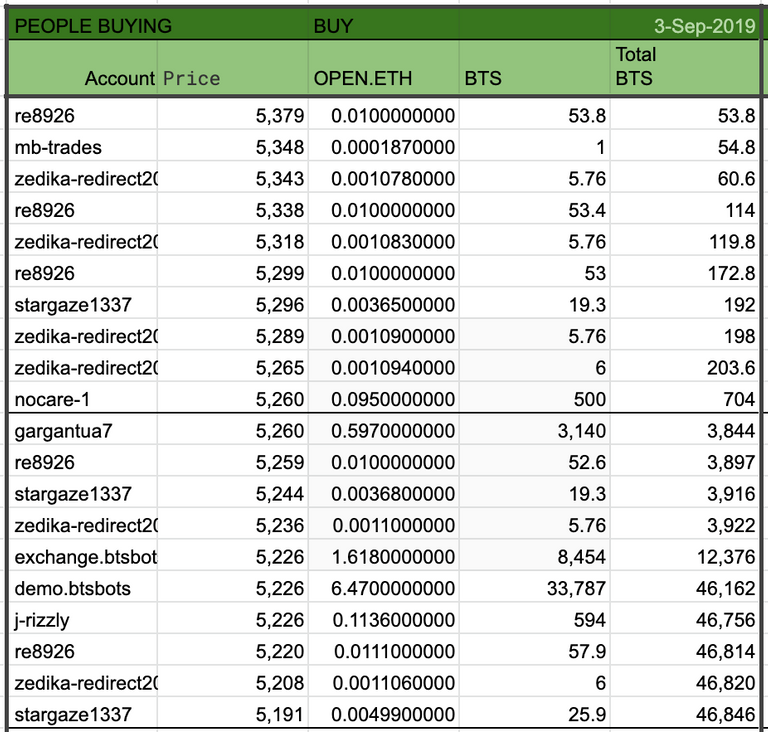
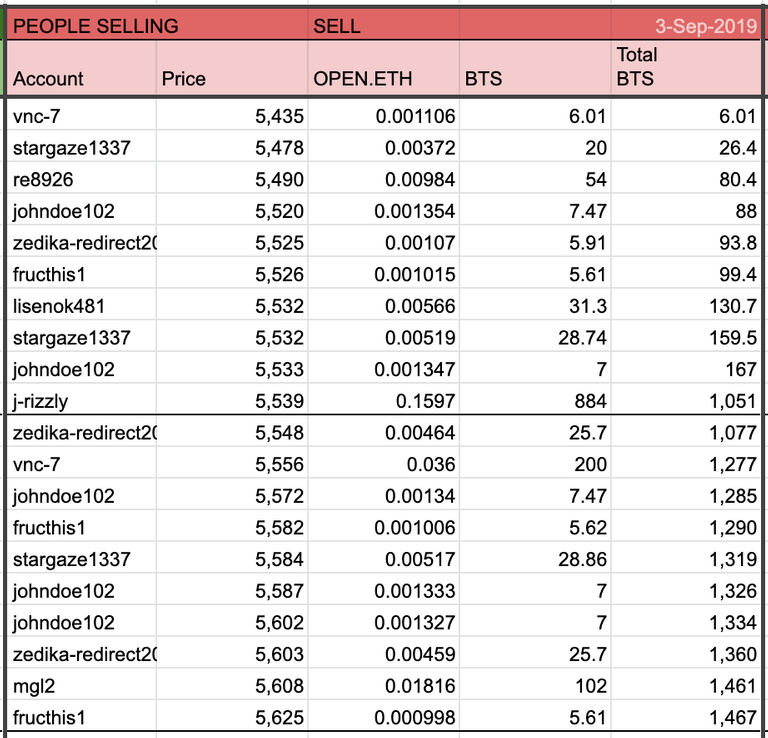
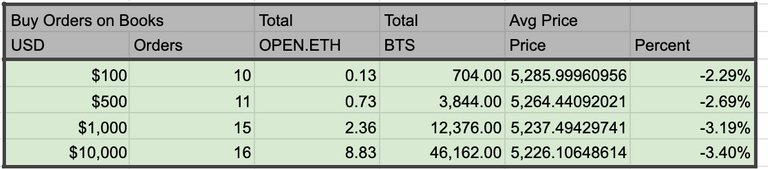
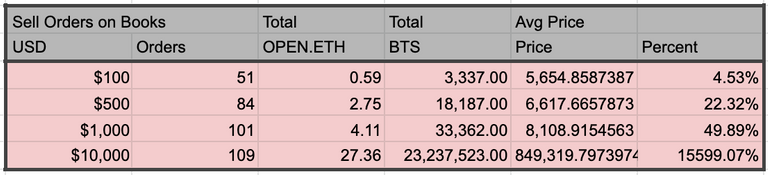
Let's take a look at some of the individual orders on the books.
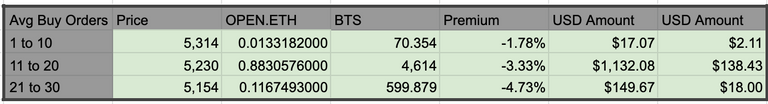
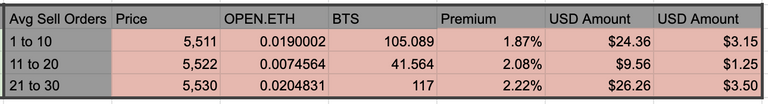
To get a better understanding of these numbers lets group the orders by ten at a time and take on average of them.
This shows the ability to buy and sell into the market.
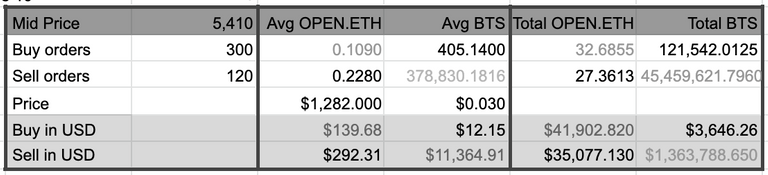
Now that we have seen the top layer of the market, let's look at statistics on the whole thing.
We need to understand the total size and amount on offer.
This data is limited to the top 300 orders on both sides of the market.
How many people or accounts make up the market?
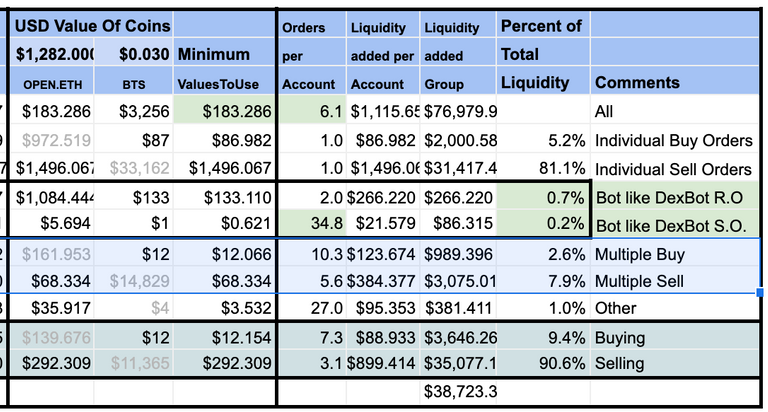
So how liquid is the market?
If you wanted to buy and sell a set amount of money, how much price premium would you pay?
This table uses USD to compare buying or selling into the market.
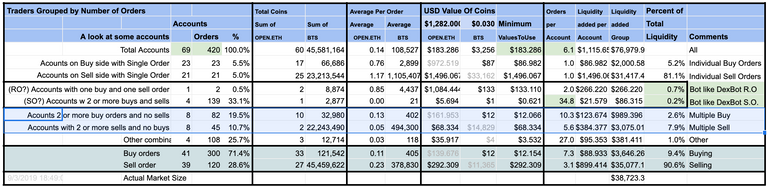
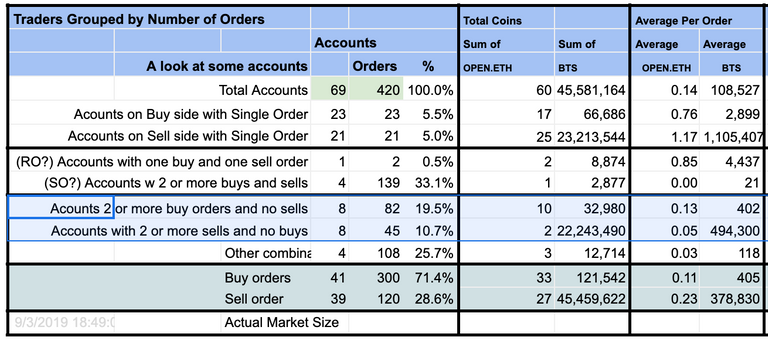
Another thing, we want to look at is who is buying and selling.
It can be helpful to look through the market, and divide the orders by the number of orders per account.
This will show us how much might be individuals and how much might be bots.
Of interest to the DEXbot group is the number of bots that are making up the market.
"Staggered Orders" counts those accounts that have multiple orders on both sides of the market.
Full Disclosure: This is all an educated guess. We don't exactly know if these are bots, or humans, but bots typically have orders on both sides of the market.
We also do not know which Bot software is being used. Both Rudex, and DEXbot have publicly available bots and there are multiple others at work in the market.
One strategy that is sort of easy to pick out is the DEXbot Staggered Orders Strategy, it has numbers orders spaced apart.
I believe, all this data is correct, but you are advised to investigate any questionable findings yourself. If you find some errors let me know and I will try to fix them.
That chart is rather big, so let's break in two.
Here is a chart that simplifies the Bot Activity
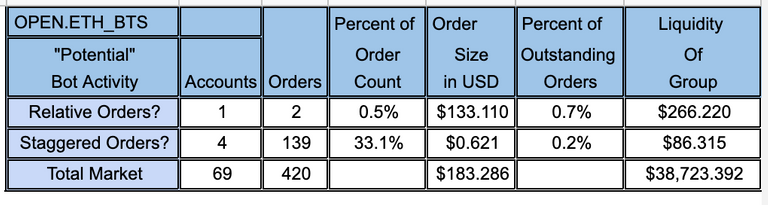
A few more thoughts
So in this case I think we are seeing several participants using a staggered orders strategy and are out of range on the market. If you look at the market participants that have multiple orders in the market, you can see they have quite a few. It is also a little easier to look at the accounts and the number of buy sell orders on each side (B =Buy S=Sell).
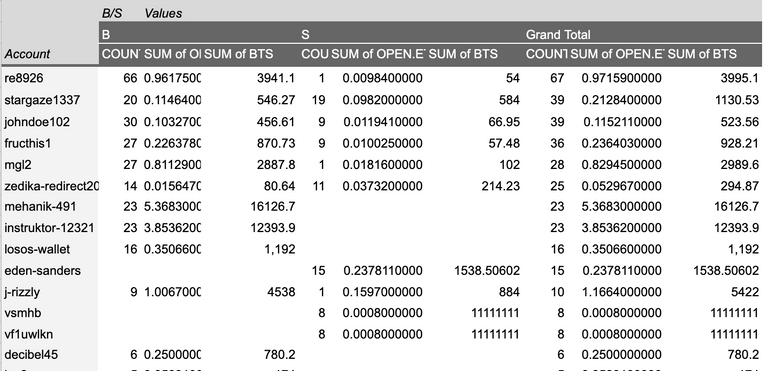
One can see by market count, Bots make up a big portion of market count, and here, in this case, I think the accounts with 2 or more buys and 2 or more sells really is mostly staggered orders bot activity. I have been doing these reports over a number of different markets and I really don’t like to change out my tables, as I want to be able to compare between markets. BTS is at a low, and so it is not surprising to see it “out of range” of a staggered orders strategy.
I think there is also value for traders to look at the ranges they use are to realize that markets are likely more volatile than they estimate. Setting up of staggered orders, what size steps to use and what type of range to use is a really good group of questions to ask and it would be nice to have better data and what the most effective parameters actually are. This would be a subject for future research.
It is also useful for DEXbot users to know which markets, most badly need liquidity and which markets most likely are going to lead to profit opportunities. These reports are also useful and helpful in that way as well. Primarily, it is about documenting the liquidity and usage that is already taking place.
Even though this report gets about a 33.5% of orders and 4.3% total liquidity provided by bots via my metrics, I feel as though about 80% of the multiple buy and multiple sell orders should also count. This would mean that about 70% of orders and 18.6% of capital is bot related.
BitShares is a Decentralized Exchange where you can buy and sell various cryptocurrencies.
The DEXbot is a free market making software where you can run your own bots on the BitShares exchange.
As a decentralized organization, people in the BitShares community step up as needed.
Once you own own BitShares you can participate in the community, and vote for worker proposals or set a proxie to vote for your interests.
Business analytics and the ability to know what is happening inside the markets is very important to people at BitShares.
Seeing a need for better analytics and understanding of the market dynamics, these reports were launched.
https://www.dexbot.info/
Data is pulled from the block chain explorer https://www.cryptofresh.com/
https://www.bitshares.org/
I believe, all this data is correct, but you are advised to investigate any questionable findings yourself. If you find some errors let me know and I will try to fix them.
The DEXbot Liquidity reports are brought to you by Cryptick1 as part of the BitShares DEXbot Worker Proposal.
One thing we do have to remember as we look at all of these bots in the market is that the bots are all supported by private capital. It might be nice to have more money on certain markets, but then -by all means- go and make the market yourself. Put your money where your mouth is. The DEXbot project has been enabling people to easily trade and make these markets, but that requires many things. It is a complicated balance.