Hello Hivers!!
First of all, I want to point out that the following post is NOT financial advice or any kind of recomandation, nor am I lisenced to give one!
It is my personal opinion and view on the chart!
Like most of the coins that I charted recently (and will be charting in future) BTS has had a pretty rough past 2 years, being in a overall downtrend.
It seems to have found a bottom around 180 satoshi and has then had a pretty heavy pump all the way to ~425 satoshi.
After the nice runup to 400 levels at the end of the february the price gradually pulled back down into the ~250 satoshi area.
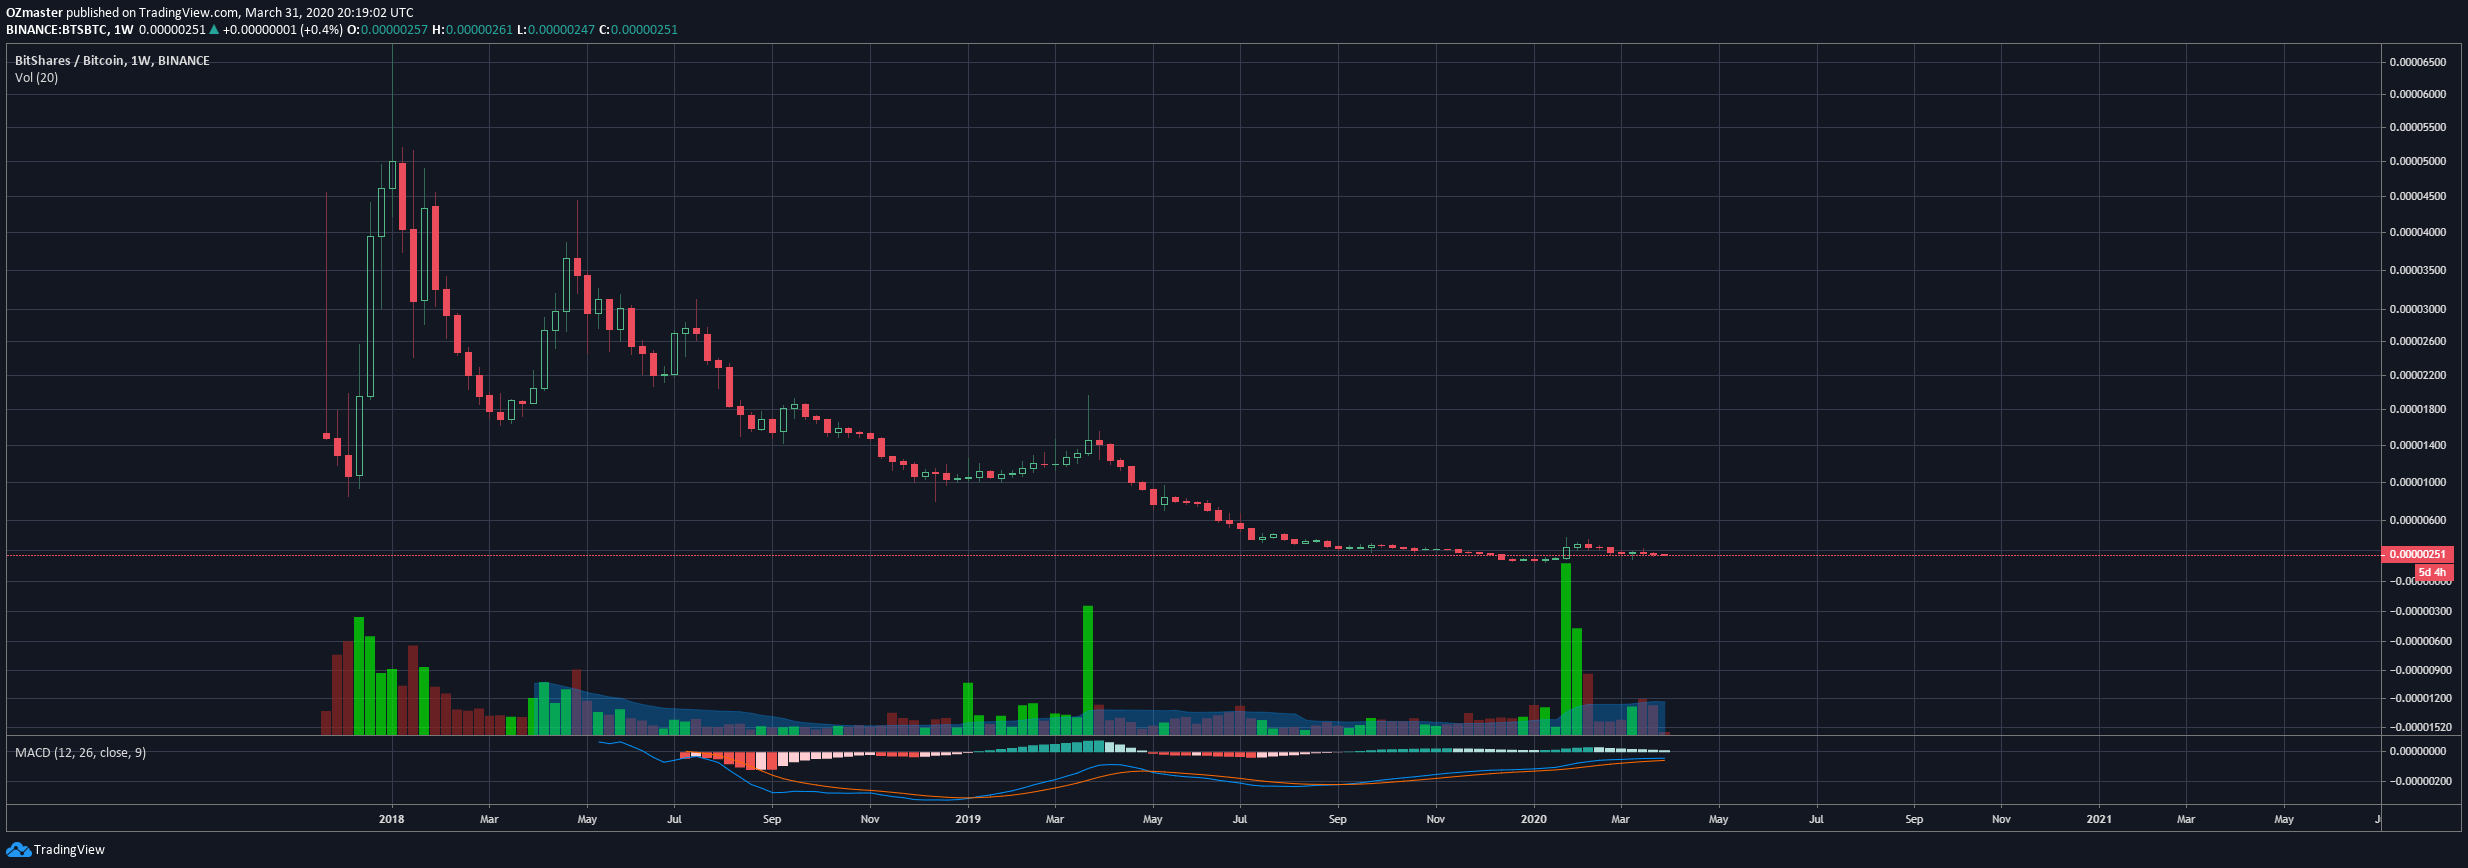
https://www.tradingview.com/x/FYyHYqBW/
To get my potential targets i market 2 support/resistance areas and pulled 2 fibs this time.
1 bigger fib, from the top of the March 19' bounce to the recently made bottom.
The 2nd, a smaller one after the runup to 400 saotshi, from the top to the prior bottom of ~180 satoshi.
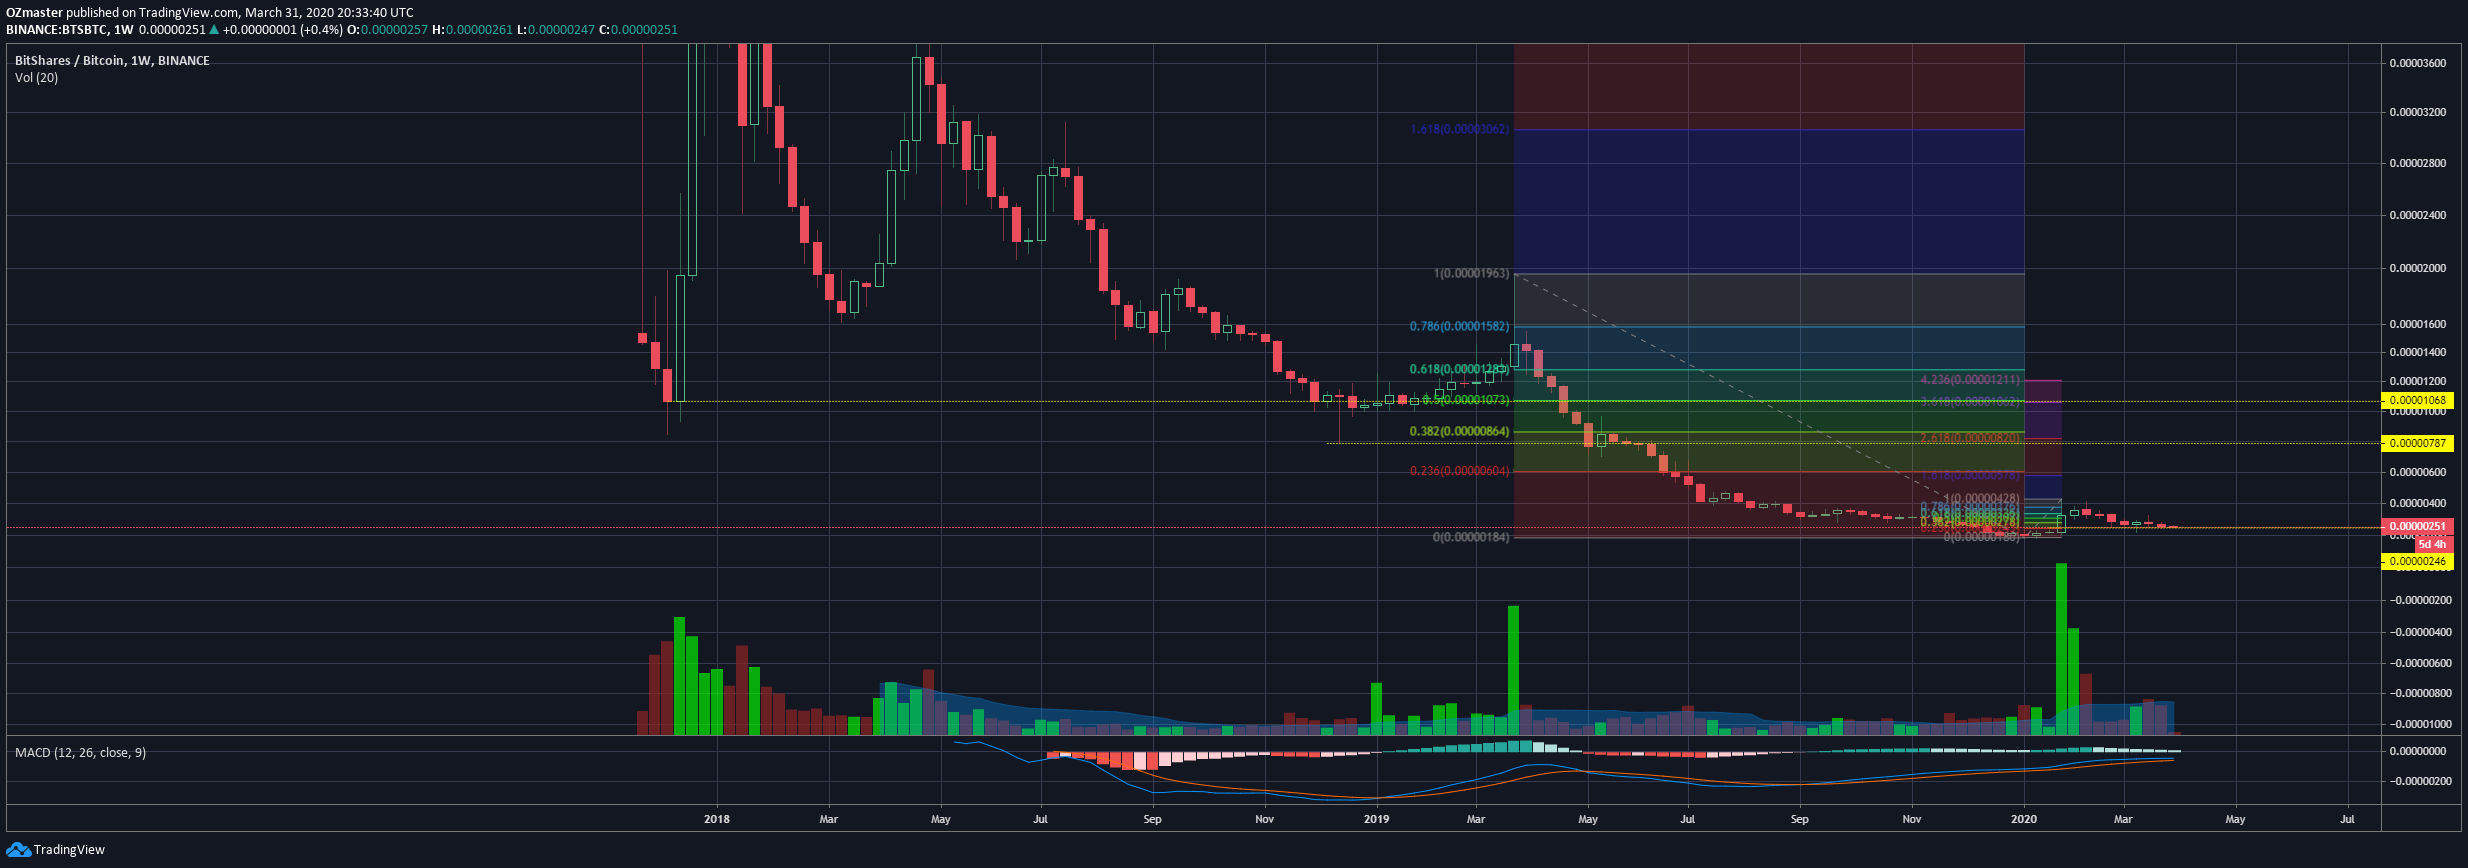
https://www.tradingview.com/x/eVtianmz/
By going from weekly into the daily chart and zooming in a bit, we can see how the price retraced down to the 0.236 fib line and seems to have found a bottom there. If this bottom doesnt break I see a decent chance for the next runup.
As potential targets im looking to find overlaps of fib lines and resistance areas, which leads me tothe conlsuion that the areas around 820 satoshi and 1050 satoshi are good targets.
In both cases we see corelation of both fibs and resistance lines, a little less accurate on the ~820 target but almost perfect overlap on the ~1050 satoshi target.
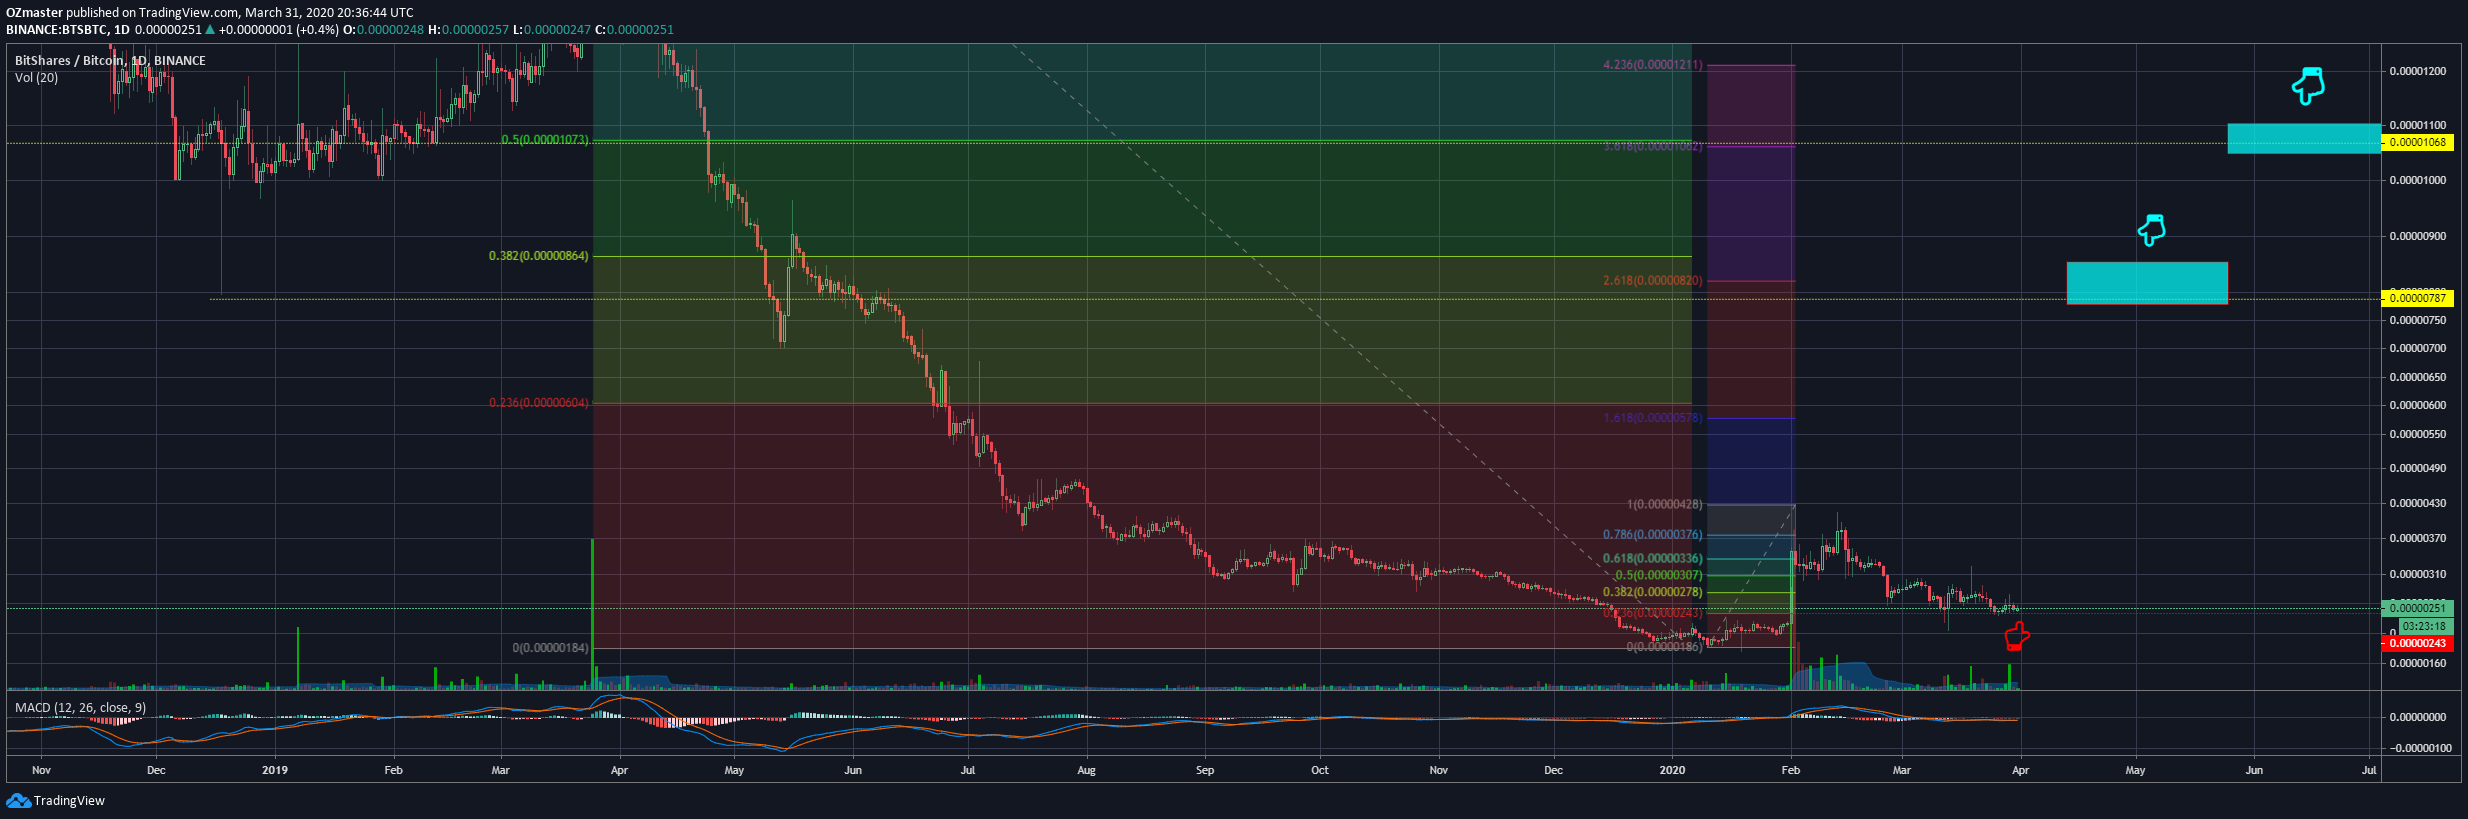
https://www.tradingview.com/x/NWHtwTSt/
Please keep in mind, this is NOT financial advice or any kind of recomandation, nor am I lisenced to give one.
Enjoy your day and stay safe! :)
Kind regards, OZ