4.3.3 Startup Configuration
The final step for implementing the testbed is for the two Imote2 to be powered on to prepare the Tosmac driver for the radio and the transmitter when turned on is always ready to receive commands from the receiver. This study uses a radio that has been prepared in previous studies. To do this put 2 startup files in "/etc/rc2.d/". File "S12loadtosmac" for radio and file "S14infloop" for receiving commands continuously. Figure 4.1 is an example when sending a "poweroff" command to turn off the device and Figure 4.2 is an example of transmission.
#!/bin/sh
insmod /lib/modules/2.6.29.1_r1.1/kernel/arch/arm/mach-pxa/ssp.ko
insmod /lib/modules/2.6.29.1_r1.1/kernel/drivers/tosmac/tos_mac.ko
mknod /dev/tosmac c 240 0
while (true)
do
/root/transmit/recv_command
Done
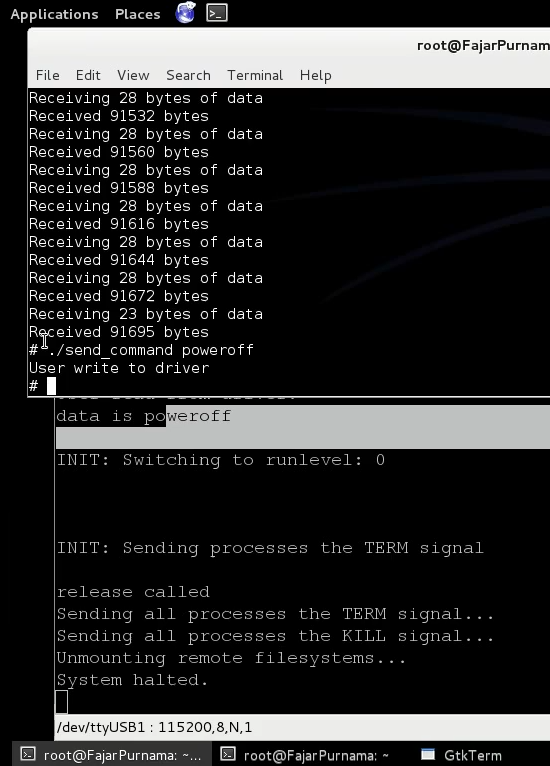
Figure 4.5 Example of giving the poweroff command
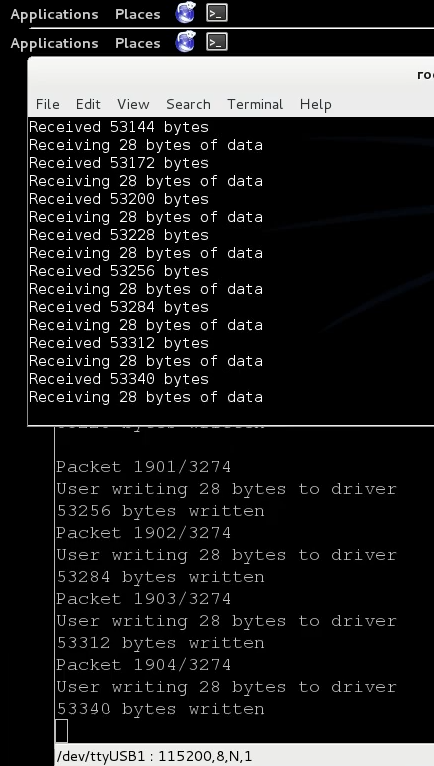
Figure 4.6 Example of transmission
4.3.4 Testbed Usage
To perform uncompressed and compressed image transmission as follows:
/root/transmit/send_command /root/command/A (raw image transmission)
/root/transmit/recv_file_advance /root/image/[output image name].ppm
/root/transmit/send_command /root/command/B (rasio 1 compression)
/root/transmit/recv (wait for compression completion notification)
/root/transmit/send_command /root/command/C (rasio 1 image transmission)
/root/transmit/recv_file_advance /root/image/[output image name].j2k
/root/transmit/send_command /root/command/D (kompresi rasio 5)
/root/transmit/recv (wait for compression completion notification)
/root/transmit/send_command /root/command/E (rasio 5 image transmission)
/root/transmit/recv_file_advance /root/image/[output image name].j2k
/root/transmit/send_command /root/command/F (rasio 10 image transmission)
/root/transmit/recv (wait for compression completion notification)
/root/transmit/send_command /root/command/G(transmisi citra rasio 10)
/root/transmit/recv_file_advance /root/image/[output image name].j2k
PSNR measurement using ImageMagick software. An image compressed with .j2k format is returned to the .ppm format with the original file size. The commands are as follows:
j2k_to_image -i [image .j2k] -o [image name .ppm]
compare -metric PSNR [original image] [compared image] [image output measurement]
Memory can be seen while the application is running with the command:
ps (can be seen the application process number)
cat /proc/[application proccess number]/status
4.4 Data Analysis
In this section we will analyze the results of research data in the form of consumption of electrical power, memory, and time in each transmission process, and also display the PSNR value of the image that has been sent. If we summarize again, the transmission process includes uncompressed and compressed image transmission based on the JPEG2000 standard with OpenJPEG 1.5.2 software ratios 1, 5, and 10, carried out at a distance of 5m, 10m, and 15m.
4.4.1 Electric Power Consumption
Overall, the results of the research data indicate that compression has a strong effect on transmission. To get the details of the electric power consumption, this study carried out the transmission process at a distance of 5 meters, 10 meters, and 15 meters respectively.
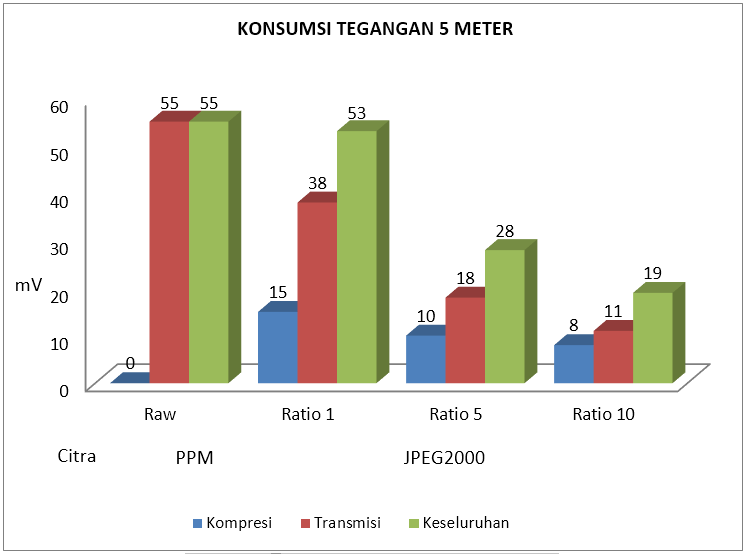
Figure 4.7 Consumption of 5 meter power supply
Figure 4.7 shows the power consumption of the transmission line at a distance of 5 meters. The stress consumption decreases constantly with the applied compression ratio. The difference in power consumption is only transmitted uncompressed images with a more efficient compressed 17 mV for a ratio of 1.37 mV and 44 mV for a ratio of 5 and a ratio of 10. If it is involved consumption while compression is still more efficient. The difference in power consumption as a whole uncompressed and uncompressed image saves 2 mV for a ratio of 1.27 mV and 36 mV for a ratio of 5 and a ratio of 10.
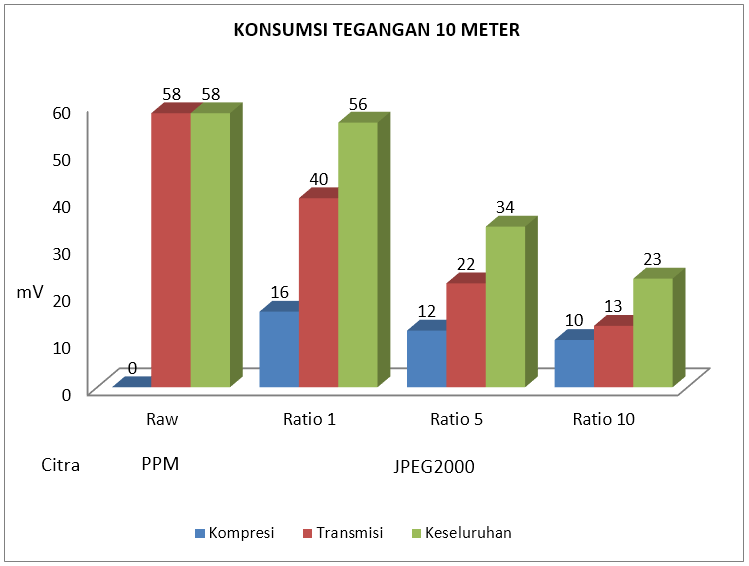
Figure 4.8 Power consumption of 10 meters
Figure 4.8 shows the power consumption of a transmission line at a distance of 10 meters. The stress consumption decreases constantly with the applied compression ratio. The difference in power consumption is only transmitted uncompressed images with a more efficient compressed 18 mV for a ratio of 1, 1.36 mV and 45 mV for a ratio of 5 and a ratio of 10. If compression consumption is involved, consumption while compression is still more efficient. The difference in power consumption as a whole uncompressed and compressed image, saves 2 mV for a ratio of 1.24 mV and 35 mV for a ratio of 5 and a ratio of 10.
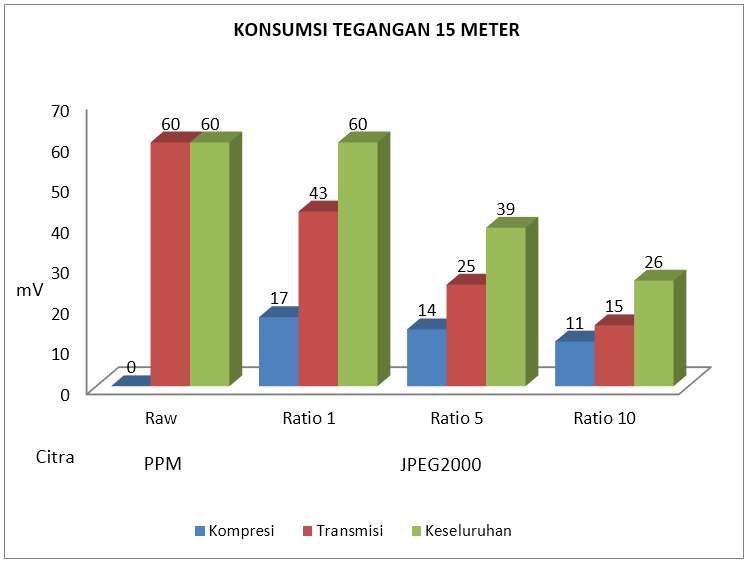
Figure 4.9 Power consumption of 15 meters
Figure 4.9 shows the power consumption of a transmission line at a distance of 15 meters. The stress consumption decreases constantly with the applied compression ratio. The difference in power consumption is only transmitted uncompressed images with a more efficient compressed 17 mV for a ratio of 1.35 mV and 45 mV for a ratio of 5 and a ratio of 10. If it is involved consumption while compression is still more efficient. The difference in power consumption as a whole uncompressed and compressed image is the same for the ratio 1, 21 mV and 34 mV for the ratio 5 and the ratio 10.
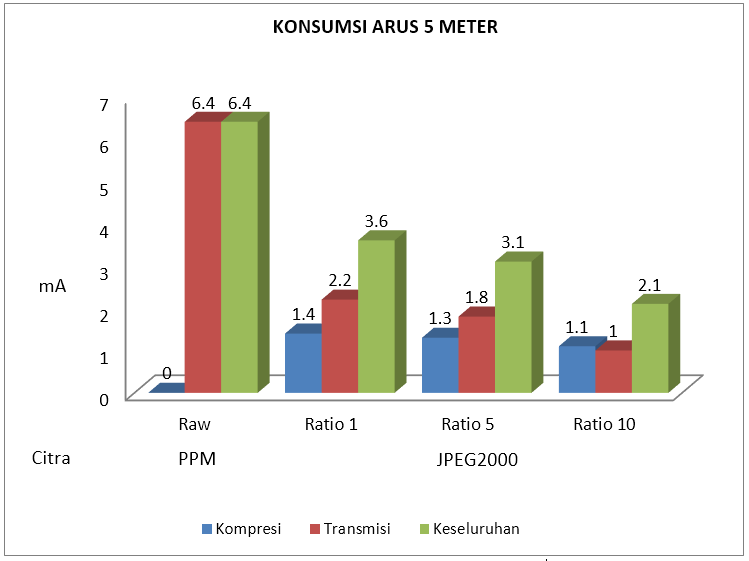
Figure 4.10 Current consumption of 5 meters
Figure 4.10 shows the current consumption of a transmission power at a distance of 5 meters. The consumption of electric current decreases with the applied compression ratio. The difference in electric current consumption is only transmitted uncompressed images with a more efficient 4.2 mA for a ratio of 1, 4.6 mA and 5.4 mA for a ratio of 5 and a ratio of 10. If it is involved consumption while compression is still more efficient. The difference between the overall consumption of uncompressed and uncompressed images is more efficient 2.8 mA for a ratio of 1, 3.3 mA and 4.3 mA for a ratio of 5 and a ratio of 10.
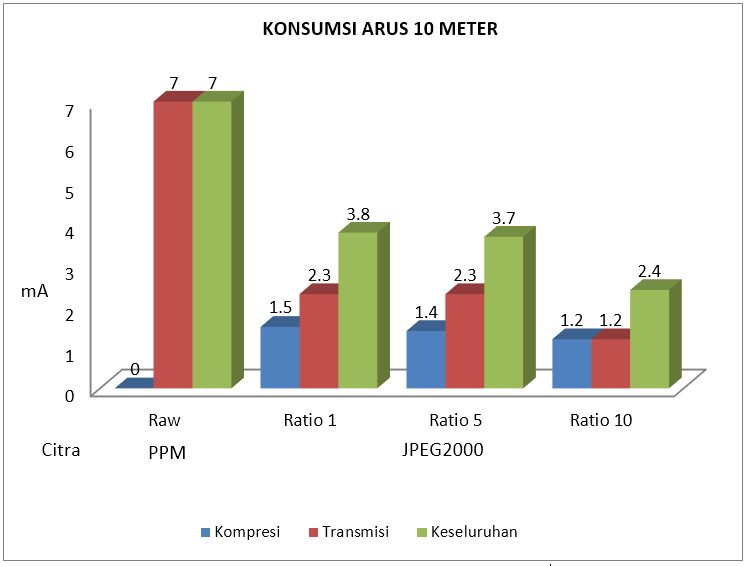
Figure 4.11 Electric current consumption of 10 meters
Figure 4.11 shows the current consumption of a transmission power at a distance of 10 meters. The consumption of electric current decreases with the applied compression ratio. The difference in electric current consumption is only transmitted uncompressed images with a more efficient 4.7 mA for a ratio of 1, 4.7 mA and 5.8 mA for a ratio of 5 and a ratio of 10. If it is involved consumption while compression is still more efficient. The difference between the overall consumption of uncompressed and compressed images is more efficient 3.2 mA for a ratio of 1, 3.3 mA and 4.6 mA for a ratio of 5 and a ratio of 10.
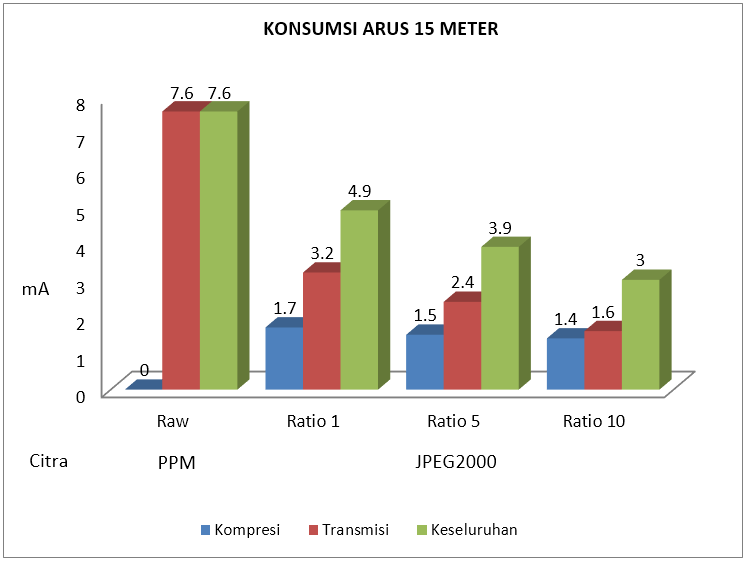
Figure 4.12 Electric current consumption of 15 meters
Figure 4.12 shows the current consumption of a transmission power at a distance of 15 meters. The consumption of electric current decreases with the applied compression ratio. The difference in electric current consumption between uncompressed and compressed images with a more efficient 4.4 mA for a ratio of 1, 5.2 mA and 6 mA for a ratio of 5 and a ratio of 10. If it is involved consumption while compression is still more efficient. The difference in electric current consumption as a whole uncompressed and compressed images is more efficient 2.7 mA for a ratio of 1, 3.7 mA and 4.6 mA for a ratio of 5 and a ratio of 10.
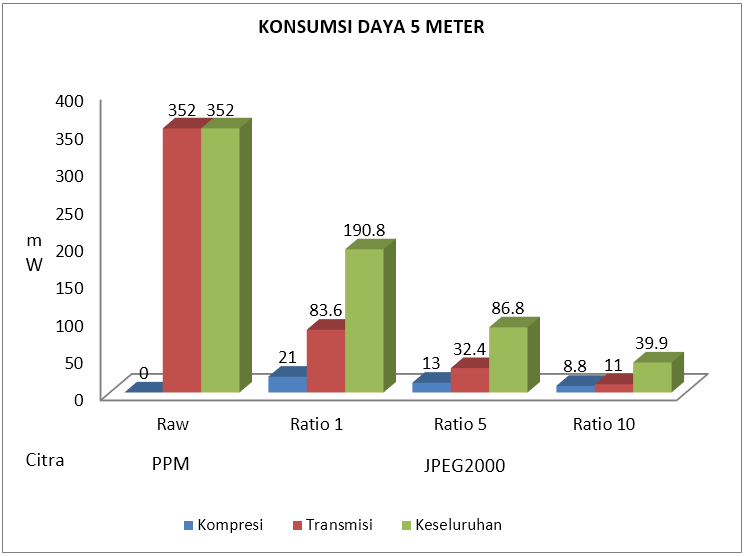
Figure 4.13 Electric power consumption of 5 meters
Figure 4.13 shows the power consumption of transmission electricity at a distance of 5 meters. The power consumption decreases drastically with respect to the compression ratio applied. The difference in power consumption between uncompressed and compress images are more efficient 268.4 mW for a ratio of 1, 319.6 mW and 341 mW for a ratio of 5 and a ratio of 10. If it is involved consumption while compression is still more efficient. The difference between the overall consumption of uncompressed and compressed images is 161.2 mW for a ratio of 1,265.2 mW and 312.1 mW for a ratio of 5 and a ratio of 10.meter.
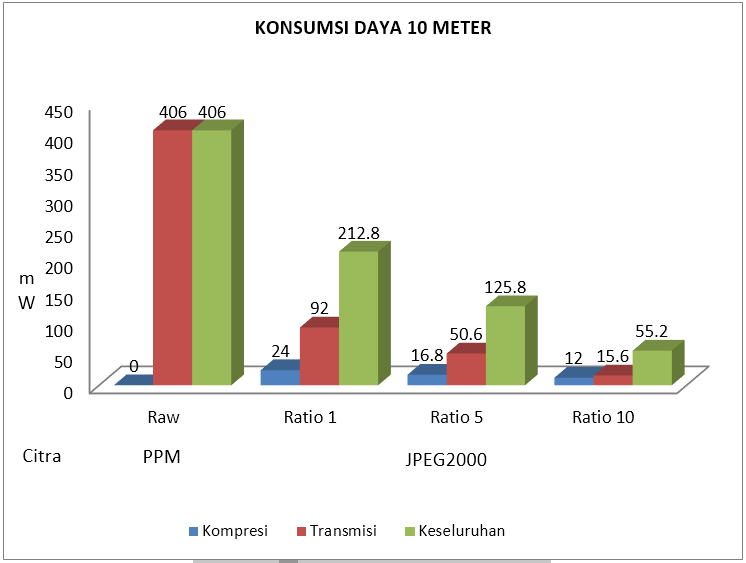
Figure 4.14 Power consumption of 10 meters
Figure 4.14 shows the power consumption of a transmission at a distance of 10 meters. The power consumption decreases drastically with respect to the compression ratio applied. The difference in power consumption is more efficient compressed 314 mW for a ratio of 1, 355.4 mW and 390.4 mW for a ratio of 5 and a ratio of 10. If it involves consumption while compression is still more efficient. The difference between the overall consumption of uncompressed and compressed images is 193.2 mW for a ratio of 1, 280.2 mW and 350.8 mW for a ratio of 5 and a ratio of 10.
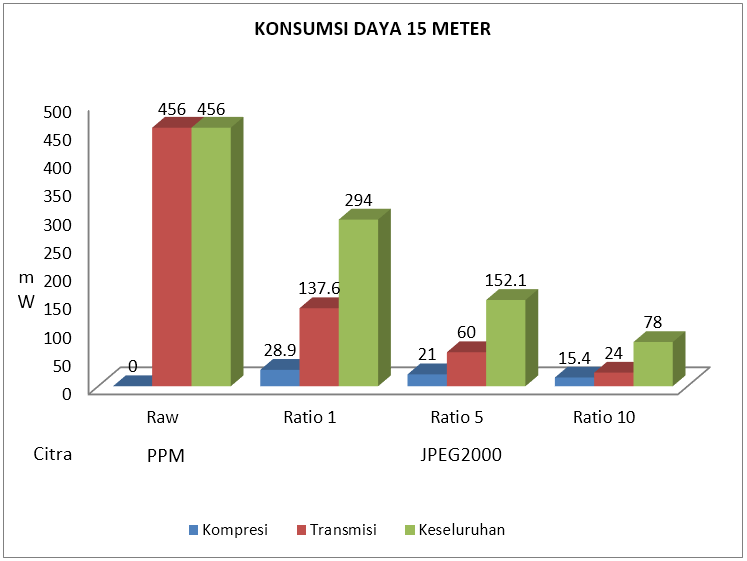
Figure 4.15 Power consumption of 15 meters
Figure 4.15 shows the power consumption of a transmission at a distance of 15 meters. The power consumption decreases drastically with respect to the compression ratio applied. The difference in power consumption is more efficient compressed 318.4 mW for a ratio of 1, 396 mW and 432 mW for a ratio of 5 and a ratio of 10. If it involves consumption while compression is still more efficient. The difference between the overall consumption of uncompressed and compressed images is 162 mW more efficient for a ratio of 1, 303.9 mW and 378 mW for a ratio of 5 and a ratio of 10.
From Figure 4.7 - Figure 4.15 it can be concluded that in terms of power consumption and compression processing time is very low but it can significantly reduce the transmission load so it is highly recommended to use it. By applying a higher compression ratio, it will reduce the current and voltage consumption when the automatic transmission of the electric power consumed is lower. Also as the compression ratio increases, the current consumption and the power supply voltage decreases so that it is ensured that increasing the compression ratio will lighten the transmission load. The farther the transmission distance, the greater the power consumption, but the difference between the distances of 5 meters, 10 meters and 15 meters is not significant.
4.4.2 Transmission Processing Time
Apart from the consumption of electric power, from a time perspective there is also a drastic effect of compression, but there is almost no visible effect in terms of distances of 5 meters, 10 meters, and 15 meters. Figure 4.16 shows the time required for compression and transmission, while Figure 4.17 represents the overall time required which is a combination of compression and transmission.
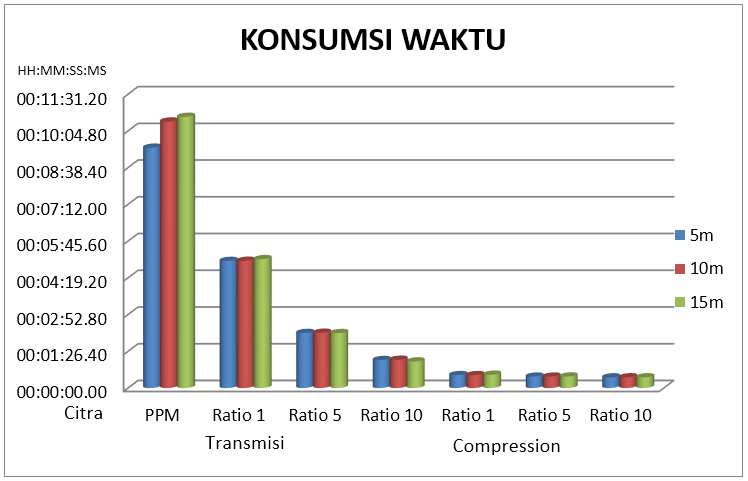
Figure 4.16 Time consumption of compression and transmission
Figure 4.16 shows that compression takes a very short time and very lowers the time required for transmission. The greater the compression ratio that is applied, the smaller the transmission time. The compression time will take 25-30 seconds. The transmission time is getting smaller from raw image to compressed image with ratio of 10 with a value of about 10 minutes 30 seconds, 5 minutes, 2 minutes, and 1 minute.
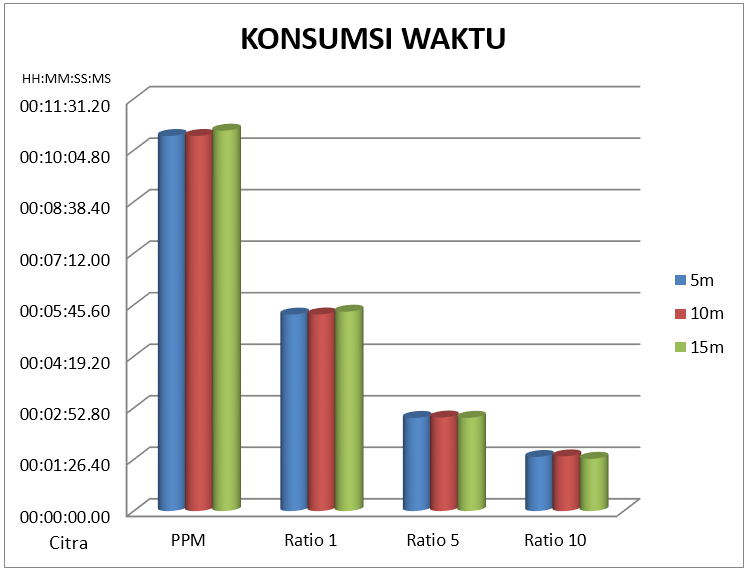
Figure 4.17 Overall time consumption
Overall from a distance perspective it doesn't seem to matter but compression, which plays a role in shortening the transmission time. An image that is compressed with a ratio of 10 takes an overall time of 1 minute 30 seconds, a ratio of 5 2 minutes 30 seconds, a ratio of 1 4 minutes 30 seconds, and 10 minutes for an uncompressed image.
4.4.3 Image Quality
In terms of time, it is also seen in terms of image quality using the PSNR size.
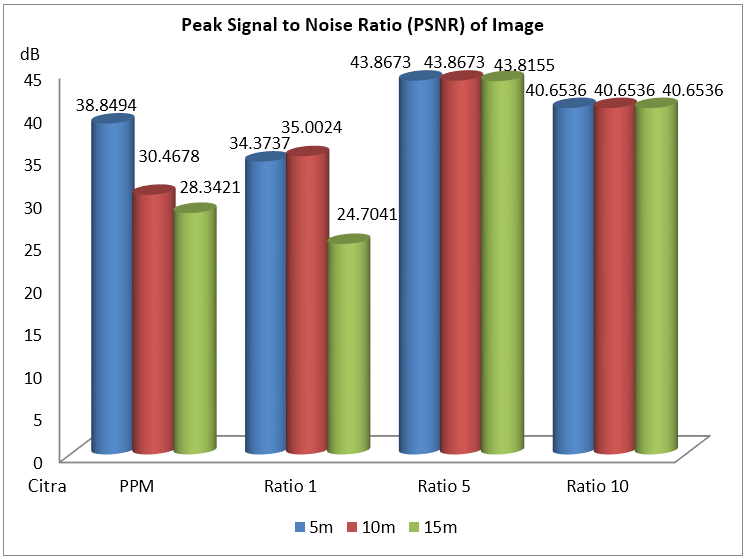
Figure 4.18 PSNR image after transmission process
Figure 4.18 shows the uncompressed PSNR image after transmission at a distance of 5 meters, 10 meters, 15 meters. The ratio of 10 both of 5 meters, 10 meters and 15 meters has the same PSNR of 40.6536, similarly to the ratio of 5 around the value of 43.8. The effect of distance is seen in ratio 1 and without compression, for ratio 1 the PSNR value is around 35 for 5 meters and 10 meters, and drops significantly at 15 meters with a PSNR value of 24.7041. The effect of distance can be seen in the image without compression, for ratios 5 and 10, the effect of distance is not visible. In the image without compression, the PSNR value decreases with the farther distance, 5 meters, 10 meters, and 15 meters, respectively, is 38.8494, 30.4678, 38.3421.
So it can be concluded that ratio 1 has the worst quality after uncompressed image, while ratio 10 has promising quality, and ratio 5 shows the best quality. From the viewpoint, the image with PSNR below 40 dB looks clearly not like the original. The cause is a transmission error.
4.4.4 File Size and Memory
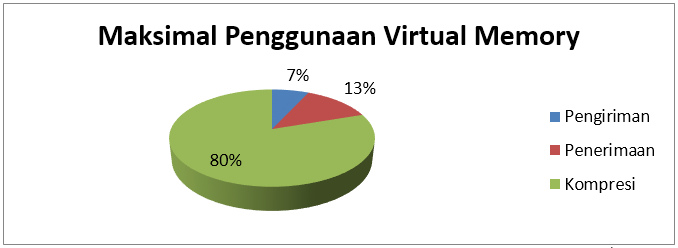
Figure 4.19 Comparison of the maximum use of virtual memory
Figure 4.19 shows the maximum virtual memory used, and the most widely used during compression. For compression using a maximum of 14548 kB of virtual memory and sending using 1256 kB at the transmitter, the receiver uses a maximum of 2336 kB of virtual memory for reception.
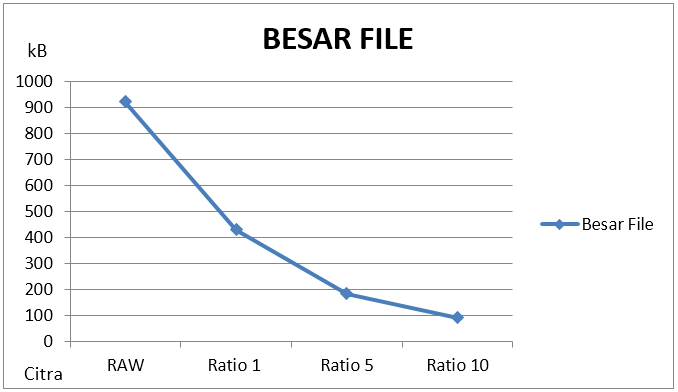
Figure 4.20 Image file size
Figure 4.20 shows the uncompressed and uncompressed image file size, the file size decreases by applying a larger ratio. The file size for the uncompressed image is 921.6 kB, the ratio 1 429.9 kB, the ratio 5 184.2 kB, and the ratio 10 91.7 kB. In terms of image quality, the original image and the compressed ratio of 1 have lower PSNR than other images, and it can be seen from the image that there is a transmission error. Then the larger the file size, the more sensitive it is to errors.
Chapter 5 Closing
5.1 Conclusion
From this overall research, it can be concluded as follows:
- The implementation of the OpenJPEG codec on the Imote2 Linux embedded system is compiled with arm-xscale-linux-gnu, jpwl enabled and tiff disabled, and additional dependencies are required, namely lcms2, zlib, and libpng.
- Imote2 Linux embedded system image transmission implementation mechanism requires a program written in C language with the required function file delivery features, including "creat", "open", "close", "read", and "write". The solution for a buffer that is finite is a maximum of 28 bytes, so the transmission is incremental so that the looping function is implemented. For the purposes of the testbed, a command-sending and command-receiving program was created, with the sending program as sending characters, and the receiving program as receiving characters, adding the function "system" so that these characters are treated as commands, then activated at startup.
- This research has succeeded in transmitting images, transmitting images on the Imote2 Linux embedded system where the image is captured without compression resulting in an image file size of 921.615 kB, at a distance of 5 meters to 15 meters consuming electrical power between 350 mW - 450 mW, takes between 10 minutes - 15 minutes, with 2000 kB of memory for each transmission.
- The application of the JPEG2000 scheme to the image in the transmission process greatly eases the transmission burden in terms of electrical power and transmission time. Image transmission with a distance of 5 meters to 15 meters produces, for a ratio of 1 consumes 191 mW - 294 mW of power with a transmission time of about 5 minutes, a ratio of 5 consumes 87 mW - 152 mW of power with a transmission time of about 2 minutes, and a ratio of 10 consumes power supply 40 mW - 78 mW with a transmission time of 1 minute 30 seconds.
- In terms of image quality, it shows good performance at a ratio of 5 and a ratio of 10. The main cause is the file size, where the larger the file size the greater the transmission time, thus increasing the chance of bit error transmission.
5.2 Future Work
By successfully transmitting images to Imote2 Linux, this tool can be used for both fieldwork and further research. The following are suggestions for further research:
- In this study, transmission control is still minimal, so furthermore, a transmission system can be developed that applies error and flow control from the data communication field.
- The transmission is limited to point-to-point (between devices), so multi-hop transmission should be applied.
- Technical research for operating Imote2 Linux is still via the command-line, it is recommended to create a graphical user interface (GUI) version of the operation for easy use and research.
- The transmission distances in this study are 5 meters, 10 meters, and 15 meters, the distance can still be varied according to the datasheet up to a maximum of 100 meters.
- Image compression can be varied from features of the JPEG2000 to applying other image compression standards, further to video.
- Multimedia Sensor Board IMB400 also has a sound sensor that has not been touched in this study, when combined with video it can be developed into an audio-video monitoring environment.
- If multi-hop and audio-video can be applied then it can be continued with the next research, namely distributed audio-video streaming on embedded systems.
Image

Figure 1. Original image
Figure 2. Uncompressed image after 5 meter transmission
Figure 3. Uncompressed image after 10 meter transmission
Figure 4. Uncompressed image after 15 meter transmission
Figure 5. Compressed image of 1 ratio after 5 meter transmission

Figure 6. Compressed image ratio 1 after 10 meter transmission

Figure 7. Compressed image ratio 1 after 15 meter transmission

Figure 8. Image compressed ratio of 5 after 5 meter transmission

Figure 9. Compressed image of 5 ratio after 10 meter transmission

Figure 10. Compressed image of 5 ratio after 15 meter transmission

Figure 11. Compressed image ratio of 10 after 5 meter transmission

Figure 12. Compressed image ratio of 10 after 10 meter transmission

Figure 13. Compressed image ratio of 10 after 15 meter transmission
Bibliography
- Ahmad, A. 2005. Wireless and Mobile Data Networks. New Jersey : John Wiley & Sons Ltd.
- Akyildiz, I, F. Vuran, M, C. 2010. Wireless Sensor Networks. Chichester : John Wiley & Sons Ltd.
- Boliek, M. Christopoulos, C. Majani, Eric. 16 Maret 2000. JPEG 2000 Part I Final Committee Draft Version 1.0. ISO/IEC FCD15444-1 : 2000.
- Daintree Network, Inc. 2006. Understanding the ZigBee Application Framework. Daintree Networks Inc. http://www.daintree.net/downloads/whitepapers/understanding_application_framework_whitepaper.pdf. Diakses: 27 Januari 2014.
- Ergen, S, C. 10 September 2004. ZigBee/IEEE 802.15.4 Summary. http://staff.ustc.edu.cn/~ustcsse/papers/SR10.ZigBee.pdf. Diakses: 27 Januari 2014.
- Garcia-Sanchez, A. Garcia-Sanches, F. Losilla, F. Kulakowski, P. Garcia-Haro, J. Rodriguez, A. Lopez-Bao, J. Palomares, F. 3 Agustus 2010. Wireless Sensor Network Deployment for Monitoring Wildlife Passage. mdpi.com., hal. 7236-7262.
- Irwin, J, D. 1993. Basic Engineering Circuit Analysis Fourth Edition. New York : Macmillan Publishing Company.
- Karthikeyan, A. Shankar, T. Srividhya, V. Sarkar, S. Gupte, A. 20 Januari 2013. Energi Efficient Distributed Image Compression Using JPEG2000 in Wireless Sensor Networks (WSNs). Journal of Theorical and Applied Information Technology, vol. 47, no. 2, hal.860-869. http://www.jatit.org. Diakses: 14 Oktober 2013.
- Kasteleiner, J. 2010. “Principles of applying Embedded Linux on Imote2” (Diploma Thesis). Faculty of Computer Science and Engineering, University of Applied Sciences Frankfurt am Main.
- Mowafi, M. Awad, F. Taqieddin, E. Banimelhem, O. 25-27 April 2011. Experimental Evaluation of Image Compression and Transmission for TinyOS-Based Imote2 Platform. International Conference on Innovations in Information Technology, Abu Dhabi, hal.173-178. http://ieeexplore.ieee.org/xpl/login.jsp?tp=&arnumber=5893811&url=http%3A%2F%2Fieeexplore.ieee.org%2Fstamp%2Fstamp.jsp%3Ftp%3D%26arnumber%3D5893811. Diakses: 25 September 2013.
- Mowafi, M. Awad, F. Taqieddin, E. Banimelhem, O. 4 April 2012. A Practical Study of Jointly Exploiting Multiple Image Compression Technique for Wireless Multimedia Sensor Networks. Journal of Communication, vol. 7, no. 4, hal. 309-320. http://www.jocm.us. Diakses: 25 September 2013.
- Nasri, M. Helali, A. Sghaier, H. Maaref, H. 23-25 Maret 2010. Adaptive image transfer for wireless sensor networks (WSNs). 2010 International Conference on Design & Technology of Integrated Systems in Nanoscale Era, Hammamet, hal. 1-7. http://ieeexplore.ieee.org/xpl/login.jsp?tp=&arnumber=5487597&url=http%3A%2F%2Fieeexplore.ieee.org%2Fxpls%2Fabs_all.jsp%3Farnumber%3D5487597. Diakses: 14 Oktober 2013.
- Natha, F, S. 2012. "Performasi Platform Imote2 Menggunakan Standar 802.11 pada Jaringan Sensor Nirkabel" (Tugas Akhir), Denpasar : Jurusan Teknik Elektro., Universitas Udayana.
- Pekhteryev, G. Sahinoglu, Z. Orlik, P. Bhati, G. Mei 2005. Image Transmission over IEEE 802.15.4 and ZigBee Networks. IEEE ISCAS, Kobe. http://www.merl.com/publications/docs/TR2005-030.pdf. Diakses: 27 Maret 2014.
- Purnama, F. Widyantara, I, M, O. Sastar, N, P. 14-15 November 2013. Implementasi Embedded Linux pada Jaringan Sensor Nirkabel Platform Imote2. Prosiding Conference on Smart-Green Technology in Electrical dan Information Systems, Bali, hal. 91-96. http://ojs.unud.ac.id/index.php/prosidingcsgteis2013/article/download/7259/5508.Diakses: 27 Maret 2014.
- Shi, Y. Sun, H. 2007. Image and Video Compression for Multimedia Engineering Second Edition. Broken Sound Parkway NW : Taylor & Francis Group, LLC.
- Shwe, H, Y. Wang, C. Chong, P, H, J. Kumar, A. September 2013. Robust Cubic-Based 3-D Localization for Wireless Sensor Networks. wireless sensor network, vol. 5, no. 9, hal. 169-179. www.scirp.org. Diakses: 12 Oktober 2013
- Wiasta, I, M. 2012. “Performasi Platform Imote2 pada Jaringan Sensor Nirkabel” (Laporan Tugas Akhir). Denpasar : Jurusan Teknik Elektro, Universitas Udayana.
Mirror
- https://www.publish0x.com/fajar-purnama-academics/image-transmission-on-wireless-visual-sensor-networking-devi-xzyoglx?a=4oeEw0Yb0B&tid=hive
- https://0fajarpurnama0.github.io/bachelor/2020/11/07/final-project-fajar-purnama
- https://0fajarpurnama0.medium.com/image-transmission-on-wireless-visual-sensor-networking-devices-imote2-platform-based-on-ieee-802-15-ab62db1b8f4d
- https://hicc.cs.kumamoto-u.ac.jp/~fajar/bachelor/final-project-fajar-purnama
- https://blurt.blog/blurtech/@fajar.purnama/image-transmission-on-wireless-visual-sensor-networking-devices-imote2-platform-based-on-ieee-802-15-4-zigbee-embedded-linux-1?r=fajar.purnama
- https://blurt.blog/blurtech/@fajar.purnama/image-transmission-on-wireless-visual-sensor-networking-devices-imote2-platform-based-on-ieee-802-15-4-zigbee-embedded-linux-2?r=fajar.purnama
- https://blurt.world/blurtindonesia/@fajar.purnama/transmisi-citra-pada-perangkat-jaringan-sensor-visual-nirkabel-platform-imote2-berbasis-ieee-802-15-4-zigbee-embedded-linux-3?r=fajar.purnama
- https://0darkking0.blogspot.com/2020/11/image-transmission-on-wireless-visual.html
- https://hive.blog/computers/@fajar.purnama/image-transmission-on-wireless-visual-sensor-networking-devices-imote2-platform-based-on-ieee-802-15-4-zigbee-embedded-linux-1?r=fajar.purnama
- https://hive.blog/computers/@fajar.purnama/image-transmission-on-wireless-visual-sensor-networking-devices-imote2-platform-based-on-ieee-802-15-4-zigbee-embedded-linux-2?r=fajar.purnama
- https://hive.blog/indonesian/@fajar.purnama/transmisi-citra-pada-perangkat-jaringan-sensor-visual-nirkabel-platform-imote2-berbasis-ieee-802-15-4-zigbee-embedded-linux-3?r=fajar.purnama
- https://0fajarpurnama0.cloudaccess.host/index.php/9-fajar-purnama-academics/92-image-transmission-on-wireless-visual-sensor-networking-devices-imote2-platform-based-on-ieee-802-15-4-zigbee-embedded-linux
- https://steemit.com/computers/@fajar.purnama/image-transmission-on-wireless-visual-sensor-networking-devices-imote2-platform-based-on-ieee-802-15-4-zigbee-embedded-linux-1?r=fajar.purnama
- https://steemit.com/computers/@fajar.purnama/image-transmission-on-wireless-visual-sensor-networking-devices-imote2-platform-based-on-ieee-802-15-4-zigbee-embedded-linux-2?r=fajar.purnama
- https://steemit.com/indonesian/@fajar.purnama/transmisi-citra-pada-perangkat-jaringan-sensor-visual-nirkabel-platform-imote2-berbasis-ieee-802-15-4-zigbee-embedded-linux-3?r=fajar.purnama
- http://0fajarpurnama0.weebly.com/blog/image-transmission-on-wireless-visual-sensor-networking-devices-imote2-platform-based-on-ieee-802154-zigbee-embedded-linux
- https://0fajarpurnama0.wixsite.com/0fajarpurnama0/post/image-transmission-on-wireless-visual-sensor-networking-devices-imote2-platform-based-on-ieee-802-15
- https://read.cash/@FajarPurnama/image-transmission-wireless-visual-sensor-network-imote2-ieee-802154-zigbee-embedded-linux-5e1f66d3
- https://www.uptrennd.com/post-detail/image-transmission-on-wireless-visual-sensor-networking-devices-imote2-platform-based-on-ieee-802-15-4-zigbee-embedded-linux~ODAzMDc4