The COVID19 era is characterized among other things by lockdowns in
countries around the world and in US states, imposed by their
governments, attempting to limit movement, activities and commerce of
individuals and businesses, for the stated goal of limiting COVID19
incidence and mortality.

In this paper, I examine CDC data regarding the COVID19 deaths in US
states that did not have lockdowns (the control group), herein “free
states,” compared to neighboring states that did have lockdowns (the
experimental group), herein “locked states.” I examined neighboring
states that share long borders, rather than touching at only corners or
short segments, and then I examine neighboring states, free vs lockdown,
that have similar population density.
The control group showed a lower percentage of COVID19 deaths
compared to total deaths than the experimental group. This finding was
consistent over the week prior to and including the date of this
writing, May 18 to 27, 2020. CDC states’ data was updated daily over
this time, except on the weekend. The data in this paper reflects the
latest data as of the date of this writing: 5/27/2020.
Moreover, deaths from all causes, as percent of expected deaths for
this time of year, are lower in free states than in neighboring lockdown
states.
Introduction
Effectiveness of universal quarantine in disease control is apart
from questions of grave concern regarding civil liberties violations, as
well as breaking with the historical precedent of quarantining only
sick people. Any “quarantine” of well people, in fact all of a given
population, was previously known only by its more familiar name, martial
law.
Political events created a control group of free US states, as well
as an experimental group of US states that did lock down. I compare
these two groups in this study with respect to COVID19 mortality and
overall mortality.
For the purpose of working with CDC data, this paper does not
challenge the popular assumption that COVID19 is a unique infectious
agent, even though researchers have not agreed on distinct features of
this particular coronavirus. Nor have researchers yet satisfied Koch’s
postulates for isolation, purification and verification of this virus.
The COVID19 Case Fatality Rate (CFR) = 0.26% in the US.[1]
That is, approximately one of every 385 individuals who are infected
with COVID19 die of the same disease. Data from the CDC in late May
2020 show that COVID19 cases and fatalities peaked in mid-April 2020.[2]
Thereafter, daily COVID19 deaths and hospitalizations declined steadily
through the first three weeks of May 2020, by 2.7% and 3.2% per day
respectively.[3] [4]
All of this information must be strongly tempered by the nature of
what is commonly called “the COVID19 test.” It has been assumed, almost
with religious certainty, that this reverse transcriptase, polymerase
chain reaction manufacturing technique is the only or best way to test
for COVID19 infection. In fact, that technique was not designed for
diagnostic purposes at all, and its designer, Dr. Kary Mullis, had
specifically cautioned not to use it to diagnose infectious disease.[5]
A further problem with the COVID19 test has been the assigning of an
arbitrary number of iterations to produce a positive result. This has
led to magnified errors with each iteration, such that the RT-PCR test
applied to COVID19 has been found to have an 80% false positive rate,
making it nearly useless for this application.[6]
Despite these problems, “the COVID19 test” was adopted quickly in the
US and around the world. Suspicion of test results have been rife since
the beginning, famously highlighted when the President of Tanzania and
Chemistry PhD John Magufuli submitted specimens from a goat and a piece
of fruit, each submitted for testing with human names. Both samples
were then declared positive for COVID19 infection.[7]
Much criticism has been made of testing methods and declared values
for incidence and mortality. Notably, many microbiologists and
physicians have publicly criticized the daily US COVID19 death counts
announced by a portion of the US media, which have exceeded the CDC’s
daily US COVID19 death counts by over 20,000 deaths on each day (76,874
by the CDC[8], but “nearly 100,000” by CNN[9], both updated today, 5/27/2020).
Much concern has focused on the economic devastation of lockdown, a
unique historical experience, unprecedented and unlike any of our
ancestors’ approach to disease. Never in human history have well people
been quarantined on a large scale, for the purpose of disease
prevention. Martial law had in the past been acknowledged as
politically, not medically, motivated.
As a result of this quarantine, in the United States, 11.1% of
Americans lost their jobs in only 7 weeks, now 14.7% of the active US
labor force. By comparison, in the Great Depression, 10.4% of
Americans lost their jobs over a 4-year time span, 1929 to 1933, 25.6%
of the then active labor force. [10] [11] Unemployment is known to have public health consequences.
There were, remarkably, six US states in this COVID19 era where
lockdown was not ordered by the governors. The other 44 states had
lockdown. I examine the differences in COVID19 mortality among them.
The 6 free states provide a useful control group. Their neighboring
states that did have lockdown provide a useful experimental group for us
to study.
Methods
The states that did not have lockdown imposed by their state
governors in early 2020, while the rest of the US did, herein, “free
states,” are:
Arkansas, Iowa, Nebraska, North Dakota, South Dakota and Wyoming, herein AR, IA, NE, ND, SD and WY.
Data for Wyoming is not updated at the CDC at this writing, so I will exclude WY.
The free states share long borders with the following lockdown states respectively:
Mississippi, Louisiana, Oklahoma, Missouri, Minnesota, Wisconsin,
Illinois, Kansas, Colorado, and Montana, herein MS, LA, OK, MO, MN, WI,
IL, KS, CO, MT.
So I compare data from:
AR with MS, LA, OK & MO,
IA with MN, WI, MO & IL,
NE with KS & CO, and
ND & SD with MT & MN.
And then, because they have exactly the same population density, 57
people per square mile as of 2018, I separately compare Arkansas with
its neighbor Oklahoma, as well as another comparison of states with
similar population density.
Because of the inappropriate nature of “the COVID19 test,” it is
especially important to also compare all deaths in free states vs
lockdown states. I include that analysis as well.
Results
Table 1 below shows percentages derived from CDC data, updated as of the day of this writing.
Table 1
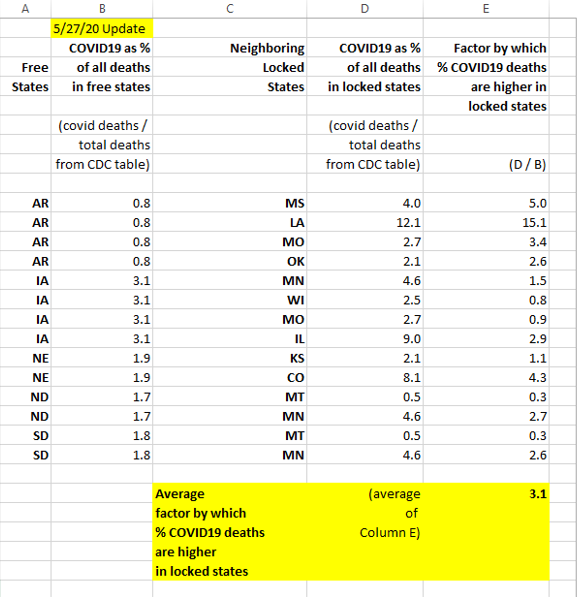
We can see that COVID19 deaths, as a percentage of total deaths, are
over 3 times higher, on average, in locked down states than in free
states.
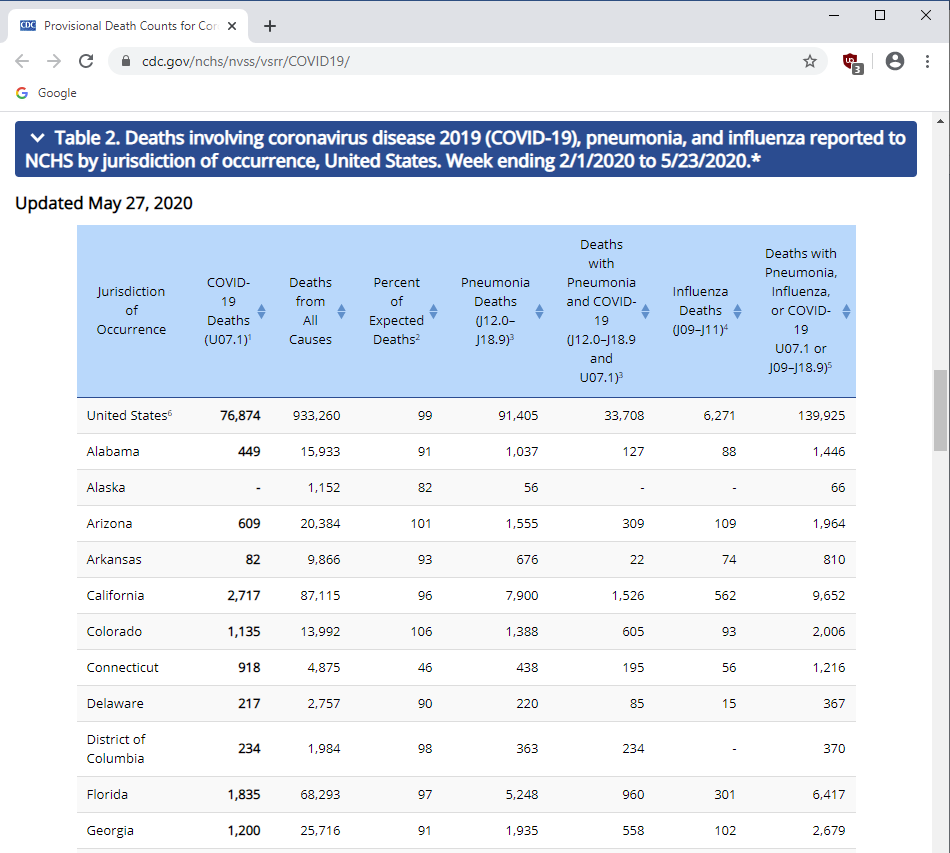
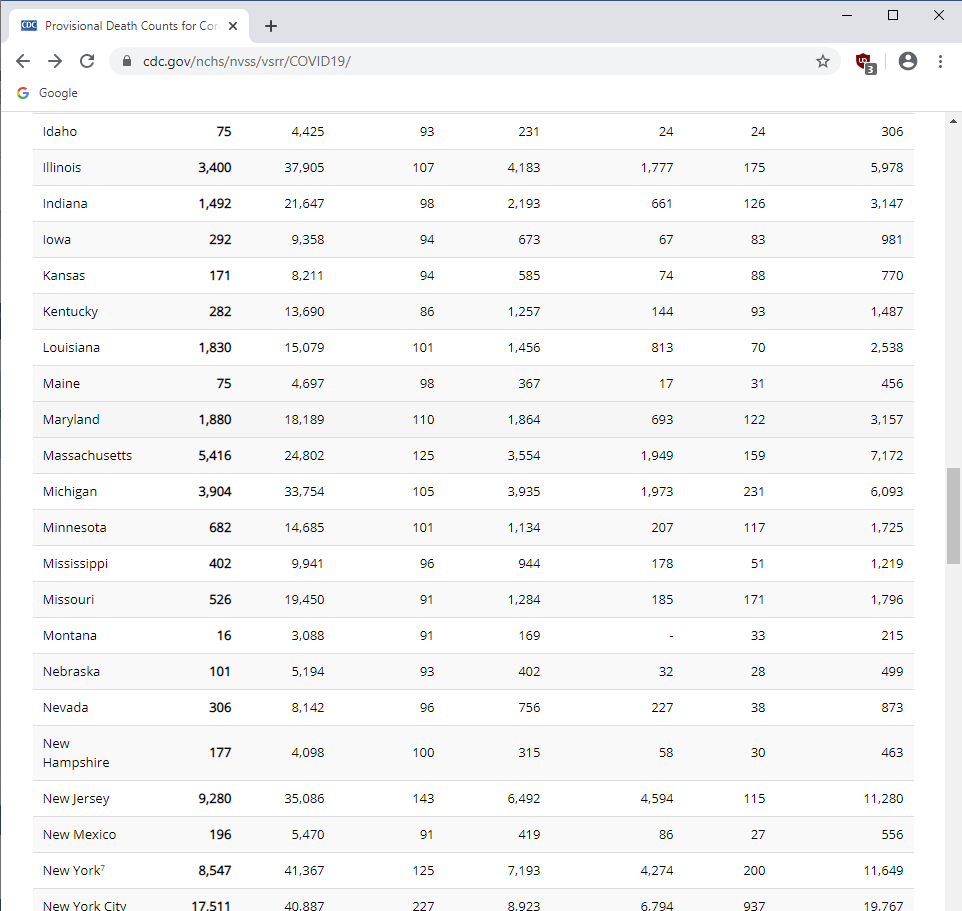
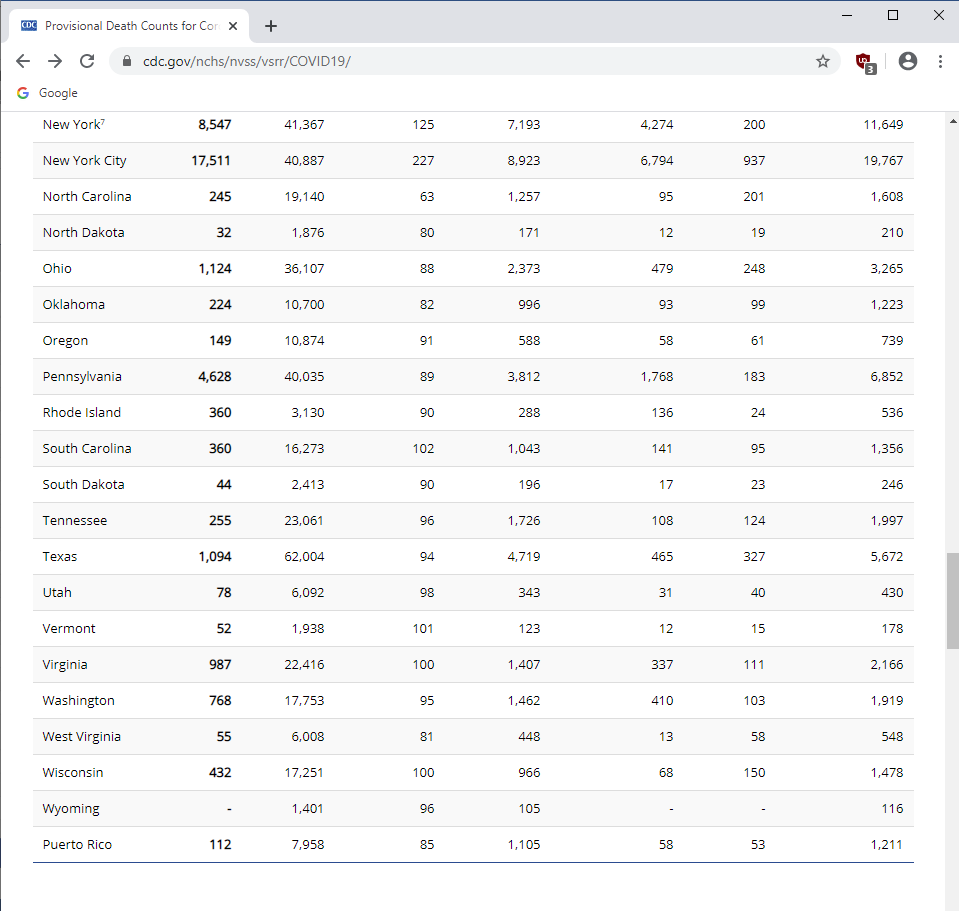
Table 2, is the May 27, 2020 CDC table of state-by-state mortality, in 3 parts, https://www.cdc.gov/nchs/nvss/vsrr/COVID19/
from which the calculations in Table 1 were derived. Those
calculations may be verified by simple division, Column 2 / Column 3 of
this CDC table.
Table 2
Some variation in mortality data among states may be expected due to
varying population density among the various states studied. However,
all states considered have rural, suburban and urban areas and
populations.
We will compare below free states vs locked states of similar population density.
Table 3 shows population density for all of the states studied, as of 2018.
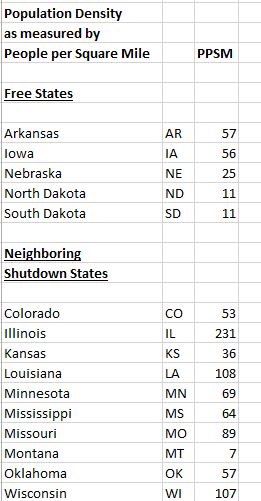
The above states have wide variation in population density, both
within states and from one state to its neighboring state, as with most
states. However, of the states considered, two have the same population
density. Both Arkansas and Oklahoma have 57 people per square mile,
and share a long border. The former is free, and the latter is locked.
Table 4 compares the Arkansas and Oklahoma data.
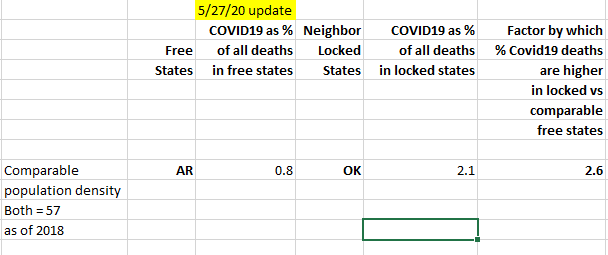
Table 5 compares data among states with population density between 53 and 57. The remaining states studied are widely divergent in population density, from 7 to 231.
Table 5
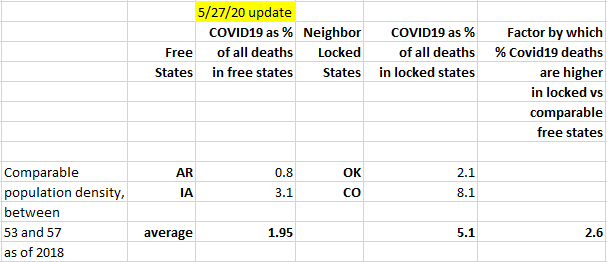
Of the states with comparable population density in the mid-50’s, the
free states Arkansas and Iowa averaged 1.95% COVID19 deaths of all
deaths. Whereas, the lockdown states of Oklahoma and Colorado averaged
5.1% COVID19 deaths of all deaths. So these two lockdown states had
more than twice the COVID19 portion of total deaths of the two
comparable free states, in fact 260% higher.
Let’s also address the problem of the inappropriate test that was
discussed above used to certify cases and deaths as COVID19. To
eliminate this problem, let’s look at total deaths in the free states vs
the neighboring lockdown states.
Table 6 compares the percent of expected deaths the past week for
this time of year in the free states with that of their neighboring
lockdown states. All of the free states show lower than expected deaths
(<100%) for the past week for this time of year. These figures are
taken from the 4th column of Table 2 at the same CDC website, https://www.cdc.gov/nchs/nvss/vsrr/COVID19/ [12]
Table 6
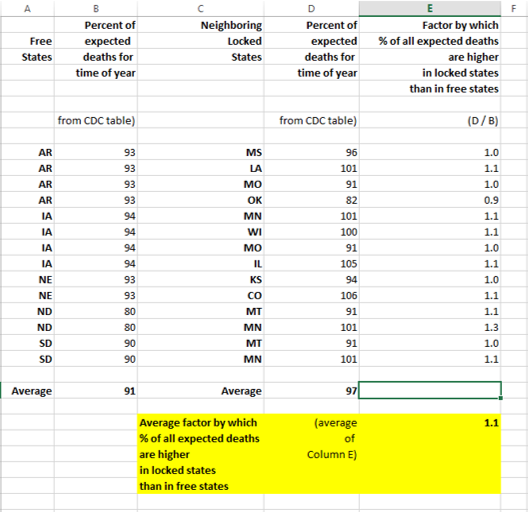
The factor by which % of all expected deaths over the reported period
are higher in the locked states than in the free states is 1.1. That
is, locked states’ percentage of all expected deaths averages 10% higher
than in the free states.
Conclusion
The proportion of COVID19 deaths to all deaths is lower on average in
the states without lockdown, the control group, than in the states with
lockdown, the experimental group. This held true also in states with
the same population density.
Also, the percent of expected deaths, for the COVID19 period compared
to previous years of the same season, from all causes, is as of this
time lower in the free states than in the lockdown states after about
two months of lockdown.
Quarantine of an entire state population, for disease control
purpose, is an experiment without historical precedent. The stated goal
of quarantine of the well population was purportedly to reduce
mortality from COVID19.
CDC data proved the experiment failed. Both COVID19 death rates were
lower, and overall deaths were lower than expected in the free states
than in neighboring lockdown states.
Further damage from society-wide quarantine, commonly known as
martial law, is economic devastation from loss of employment and loss of
small and medium-sized businesses. The collateral damage of suicides,
alcoholism and other substance abuse, anxiety and depression from this
debacle are not yet measured, nor yet measurable in full.
Therefore, having failed in its stated goal, and having caused
widespread violations of civil liberties and human rights, as well as
economic and social havoc and widespread suffering, universal quarantine
against infectious disease should not ever be repeated.
Corresponding author: Colleen Huber, NMD
Mail to: 1250 E. Baseline Rd., Suite 205, Tempe, AZ, USA 85283
[1] https://macdailynews.com/2020/05/26/new-cdc-estimate-puts-covid-19-death-rate-at-0-26/
[2] https://www.cdc.gov/nchs/nvss/vsrr/COVID19/
[3] https://twitter.com/EthicalSkeptic/status/1263614691659649024/photo/1
[4] https://COVIDtracking.com/data
[5] https://www.greenmedinfo.com/blog/does-2019-coronavirus-exist
[6] https://www.researchgate.net/publication/339770271_Potential_false-positive_rate_among_the_%27asymptomatic_infected_individuals%27_in_close_contacts_of_COVID-19_patients
Objective: As the prevention and control of COVID-19
continues to advance, the active nucleic acid test screening in the
close contacts of the patients has been carrying out in many parts of
China. However, the false-positive rate of positive results in the
screening has not been reported up to now. But to clearify the
false-positive rate during screening is important in COVID-19 control
and prevention. Methods: Point values and reasonable
ranges of the indicators which impact the false-positive rate of
positive results were estimated based on the information available to us
at present. The false-positive rate of positive results in the active
screening was deduced, and univariate and multivariate-probabilistic
sensitivity analyses were performed to understand the robustness of the
findings. Results: When the infection rate of the close
contacts and the sensitivity and specificity of reported results were
taken as the point estimates, the positive predictive value of the
active screening was only 19.67%, in contrast, the false-positive rate
of positive results was 80.33%. The multivariate-probabilistic
sensitivity analysis results supported the base-case findings, with a
75% probability for the false-positive rate of positive results over
47%. Conclusions: In the close contacts of COVID-19
patients, nearly half or even more of the ‘asymptomatic infected
individuals’ reported in the active nucleic acid test screening might be
false positives.
[7] https://www.independent.co.uk/news/world/africa/coronavirus-tanzania-test-kits-suspicion-goat-pawpaw-positive-a9501291.html
[8] https://www.cdc.gov/nchs/nvss/vsrr/COVID19/
[9] https://www.cnn.com/us/live-news/us-coronavirus-update-05-27-20/index.html
[10] https://twitter.com/EthicalSkeptic/status/1263650439658180614/photo/1
[11] https://www.cnbc.com/2020/05/19/unemployment-today-vs-the-great-depression-how-do-the-eras-compare.html
[12] https://www.cdc.gov/nchs/nvss/vsrr/COVID19/
Source: https://colleenhuber.com/covid19-a-controlled-study/
Twitter: https://twitter.com/ColleenHuberNMD
Colleen Huber, NMD is a Naturopathic Medical Doctor, a licensed physician in Arizona. She has a Fellowship of the Naturopathic Oncology Research Institute (FNORI). Her clinic is Nature Works Best.
Subscribe for natural health news to your inbox. Follow Natural Blaze on YouTube, Twitter and Facebook.
Thanks for sharing this research and for a well written, well referenced article. We need not dress the truth with emotion in order to coerce people (infact this is counter-intuitive to the cause).
The facts simply speak for themselves and because of the prominence of ideas over facts in the media, it is up to the individual to study the facts themselves.
Intuitively, I sense covid is a grand theatre but this realisation cannot simply be spouted out at anyone without any evidence. I have to do my own research to back up my claims and also I need to be willing to see all sides of the equation in an impartial manner.
This situation is causing me to be more logical and rationally deductive than any time ever before in my life. I can see that the flavour of anger I have had on my tongue to speak 'truth' in the past has damaged rather than assisted the causes I have fought so hard for.
It is now more important than ever we put our emotional responses behind us and engage in rational debate, being impartial and objective and in the right audience we will receive the same in return.