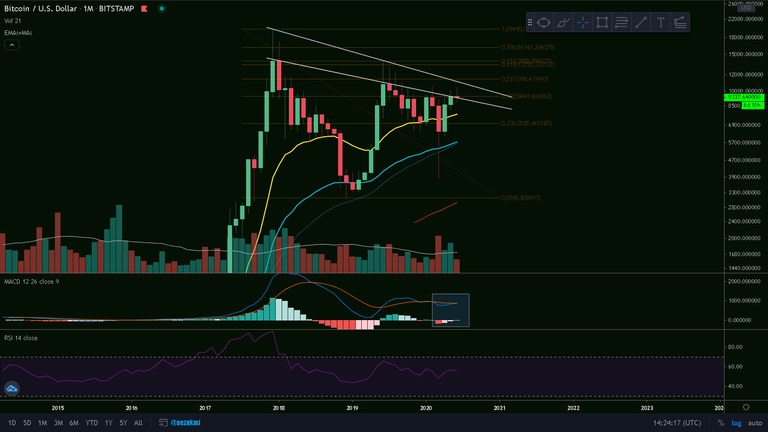
BTC Monthly Chart
In my last post I was targeting the $11500 area, but unfortunately the bulls didn't have enough power and we ended up only reaching $10200. With the current price action and the descending trend lines, it is possible that we could see a price spike to $10900 at best. So far we have a shy MACD cross (not confirmed yet), but the trading volume is 50% lower than the
previous month.
As I mentioned before, closing the monthly candle above the upper descending trend line (now $11000), should be a great bullish sign.
Ctrl + Click here to enlarge the image in a new tab (steemitimages)
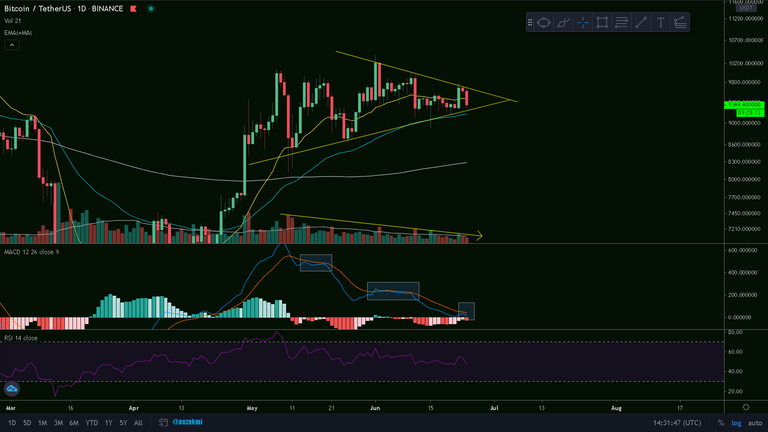
BTC Daily Chart
On the daily, Bitcoin is reaching the end of a triangle pattern, having the 55 daily EMA reinforcing the lower support line. However, considering the steadily decreasing trading volume and the nasty MACD rejections, I'd say that breaking the lower side is more probable. If this happens, we could revisit the 200 day MA ($8300). Another great play would be a huge bull trap, with BTC spiking to the $10900 region and only afterwards getting a more significant retrace.
Ctrl + Click here to enlarge the image in a new tab (steemitimages)


Thanks for reading and safe trading!✌
If you find this post useful, please:
