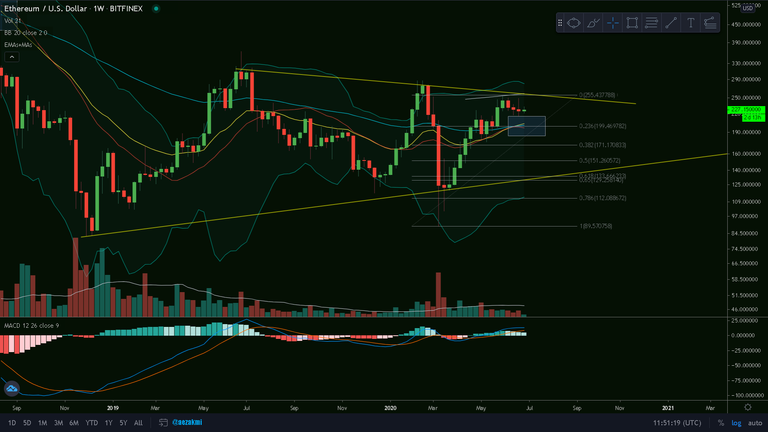
ETH/USD Weekly Chart
Not much has changed on the weekly since my last post, except that the $200 level looks very, very attractive. There is a lot of support here: the 21 and 55 weekly EMAs, the basis line of the Bollinger Bands and the 0.236 Fibonacci retracement. Besides this, $200 is also a psychological level. Retracing to this level and re-attempting to break the resistance at ~$250 would be very healthy.
The trading Volume and the MACD - Histogram are decreasing, so $200 could indeed be our next stop.
Ctrl + Click here to enlarge the image in a new tab (steemitimages)
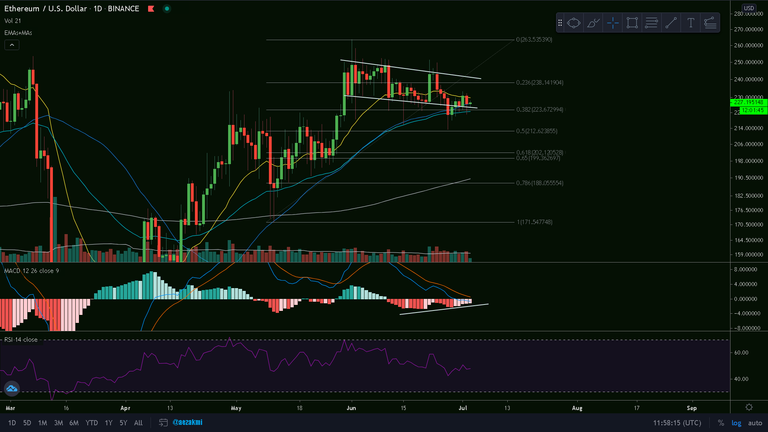
ETH/USD Daily Chart
On the daily, we're finding support at the 0.382 Fibonacci retracement, together with the 55 day EMA and 50 day MA (blues). We closed two candles below the flag pattern, but now we're back in it again. The average trading volume is slowly picking up again and we have a bullish divergence on the MACD-Histogram, nothing too serious though. Getting a further price correction to $200, as I mentioned above to the weekly chart, would bring us on the daily to the 0.618 Fibonacci retracement and the golden pocket - which, in my opinion, would be super catch.
Ctrl + Click here to enlarge the image in a new tab (steemitimages)


Thanks for reading and safe trading!✌
If you find this post useful, please:
