
The cryptocurrency markets have exploded in the recent months, it seems like every week a new exchange is launching that promises to be the best exchange with the coolest features. Crypto has also brought an entirely new demographic of people to currency/speculative trading sphere. People who have never invested or actively traded securities/investments are now finding themselves hooked on the cryptocurrency markets.
Part of this has to do with the almost ridiculous bull market that crypto saw at the end of 2017. The thought of a 100% return in 2 weeks seemed to be a huge draw for thousands of new investors. But, now that we have gone through a healthy consolidation and are on what looks like the edge of a change in market sentiment, I wanted to start a new series of technical analysis tips that may help you trade a little smarter and have a better shot at successfully using technical analysis improve your trading and investing. What is cool about all of the technical analysis tips I'm going to share is that these are the same indicators and techniques that are used for any market and can be applied in areas other than cryptocurrencies.
I wanted to start with a fairly basic indicator called the moving average line. While this concept is fairly straight forward and simple, there are several techniques that traders can use to judge the market and make more educated trades
The Simple and Exponential Moving Average Indicators
The two most common moving average lines that you will see on trading tools are the Simple Moving Average (SMA) and Exponential Moving Average (EMA). While they differ in the way they are calculated, they both perform a similar function. These indicators will show you the average price of the security over a given time frame. These indicators are a good way to see the historical trend of the market and tend to smooth out short term price fluctuations.
Both the SMA and the EMA are the average price of a security over a set number of periods. You will typically see these moving average lines identified by the number of days in which the moving average has been calculated. For example each point on a 7 day MA would be the average of the last 7 day's prices and each point on a 25 day MA would be the average of the last 25 day's prices.
Differences between EMA and SMA
Lets take a look at the differences between the SMA and the EMA. The SMA is calculated by taking the sum of the prices divided by the period indicated in the moving average. For example, for a 7 day SMA, you would simply sum the last 7 days prices and dived by 7. That would be the point for that day on your SMA line. Since the SMA is an average over a period of time you have to deal with some trade offs. The SMA does have the benefit of smoothing out large price swings in a volatile market and giving you the ability to view longer term trends. But, because the prices on the SMA line are averages of past prices, they tend to be a lagging indicator. What this means is that a change in trend, say from a bearish trend to a bullish trend, would not be identified by the SMA until some time after the new trend has already taken effect. Traders that are looking to trade on a shorter term may miss opportunities because of this lag. That is where the EMA comes into play.
THE EMA line is calculated in a similar manner as the EMA however, a weighting factor is applied to the more recent prices. Since more emphasis is given to the more recent prices, the indicator will follow more closely to the current prices. Let's look at an example
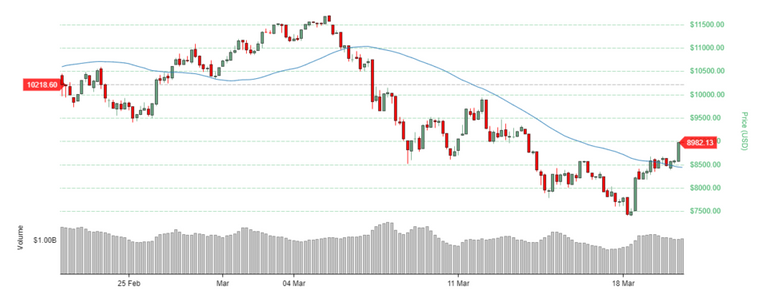
If we look at the 1 month chart for Bitcoin with a 50 day SMA line we can see that the trend line follows the general price of Bitcoin but doesn't react harshly to short term price fluctuations. If you look at the chart in early March (the peak of the chart) you can see that the SMA did not reflect the change in market trend until a few days after the price started to decline. This is the lagging indicator concept.
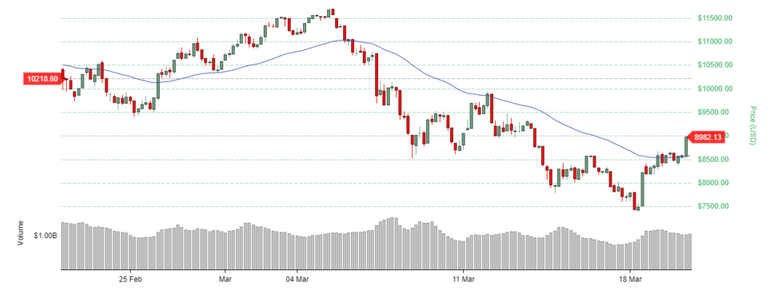
Now if we take the same chart and apply a EMA line we can see some of the differences. The easiest difference to identify is how much closer to the current price the EMA line lies. This is due to the weighting factor applied to more recent prices. Again if we look at the price drop off in early March we can see that the EMA line still lags in identifying the trend change but, the lag is a few days shorter than the SMA line. Additionally, we can see a difference is the last few days of the chart. With the SMA line above, it would seem we are still on a downward trend however, with the EMA line, it would seem as though the downward trend is beginning to switch directions.
Both the SMA and EMA lines are useful in their own respect but, can be used in different ways. Are you planning to identify longer term trends and invest for the longer term? Maybe, the SMA line will give you a better idea of the longer term trend since it doesn't react as drastically to short term price fluctuations. Or are you trying to trade on short term price fluctuations? In this case maybe the EMA would be a better indicator.
Using the Moving Average Lines
Now that you have an idea of the difference between the SMA and EMA, let's talk through a few ways you can use the moving average line to identify signals.
Identifying trends
The first, and most obvious method for using the moving average lines is to identify trends. If we look at the two charts above, we can easily see the points in which the market trends change. While it is hard to find the exact point in which the market trend changes using just a single moving average line, you can tell whether a market is moving downward, indicating it may be time to exit the market, or upward, indicating it may be time to enter the market.
Crossovers
The second method we'll walk through is crossover signals. This method involves using two moving average lines of varying time frames. The idea is that when the shorter moving average line crosses the longer moving average line, this indicates a bullish or bearish signal that the market trend is changing? For example, when the shorter moving average line overtakes the longer moving average line, this may indicate a bullish signal and that the market may be changing from a downward trend to an upward trend. This may indicate a time to enter the market. A longer term moving average line overtaking a shorter term line may indicate a bearish trend change. This may indicate a time to leave the market.
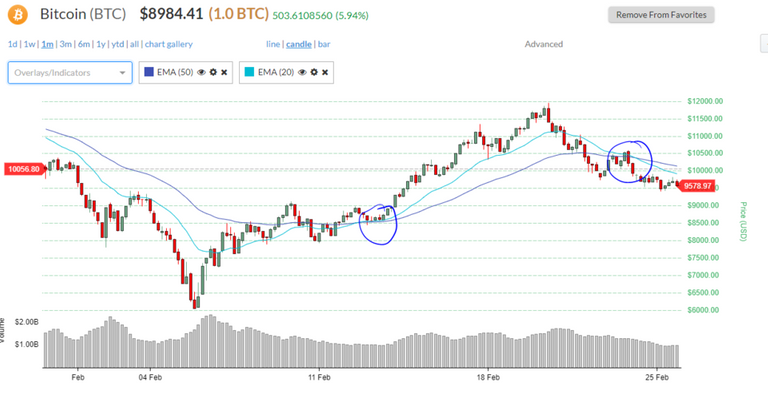
In the example below we can see where the 20 day EMA crosses over the 50 day EMA, the market then took a turn on the up trend. Then when the 50 day EMA overtook the 20 day EMA the market turned back down.
Support and Resistance
The last way we'll talk about using moving average line is for support and resistance. The idea here is that the moving average line acts as a support or resistance line for the price of the security. We'll talk move about support and resistance in another post but, in short you can use support and resistance to get a better idea of where the price may shift in the short term. And if a price breaks the support or resistance, this may indicate a change in trend.
For example, in the 1 week chat below, we can see litecoin test the restaurant a few times between the 17the and 18th but, once it breaks the resistance on the 18 the, we notice a trend change.

Conclusion
The are many more ways that moving Annette's can be used to analyze charts and even can be combined with other tools. We may get into some of these combinations later on. Hopefully this have you a better idea of how moving average lines work and how you can make user of them. Let me know below if you have other ways of using moving averages that work well for you.
This isn't investing advice, you should do your own research before investing your money. If you'd like to hear more, feel free to follow at @clshipp91

Tip 1... If everyone is bullish af. You sell.
If everyone is bearish af. You buy.
I guess that's one way to look at it lol. Not a terrible idea at all either
Congratulations! This post has been upvoted from the communal account, @minnowsupport, by clshipp91 from the Minnow Support Project. It's a witness project run by aggroed, ausbitbank, teamsteem, theprophet0, someguy123, neoxian, followbtcnews, and netuoso. The goal is to help Steemit grow by supporting Minnows. Please find us at the Peace, Abundance, and Liberty Network (PALnet) Discord Channel. It's a completely public and open space to all members of the Steemit community who voluntarily choose to be there.
If you would like to delegate to the Minnow Support Project you can do so by clicking on the following links: 50SP, 100SP, 250SP, 500SP, 1000SP, 5000SP.
Be sure to leave at least 50SP undelegated on your account.
Thank you for the up vote!