Conclusion for today’s Litecoin price analysis: Price closing above 0.011132 implies resumption of bullish strength in LTCBTC.
Litecoin/Bitcoin is presented using a candlestick chart on the 4 Hour timeframe. A log scale is used in this case with attention paid to price action starting from April 03, 2019 to current date.
Instagram: https://www.instagram.com/coin_analyst/
Twitter: https://twitter.com/Cryptotrader029
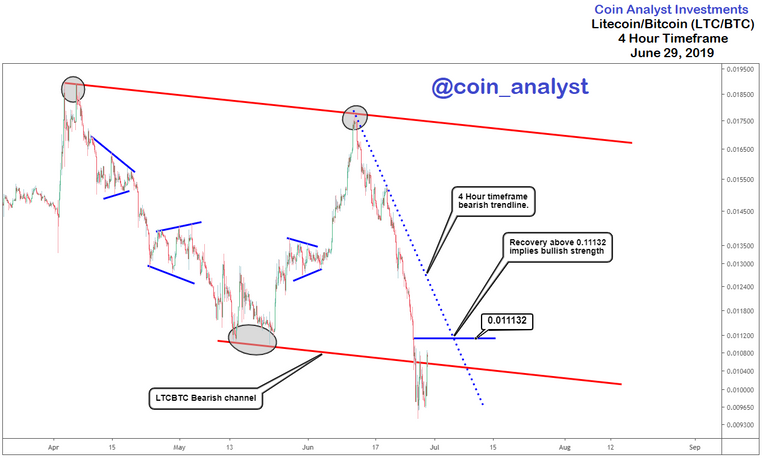
A bearish price channel (tentative) is shown on the 4 hour time with price breaking and closing below the chart pattern on June 27, 2019. Lack of continuation of momentum to the downside and recovery back into the channel both argue for a bullish bias.
Conservative strategies for a long (buy) position involves buying on a break above 0.011132, and even more conservative is waiting for the 4 hour timeframe bearish trendline to give way before buying.
P.S. It is likely that momentum to the downside is not yet complete from an Elliott wave perspective, and therefore movement is expected below 0.011132 (June 27, 2019 price low).
If this is the case, completion of a move to the downside would mark the end of the downtrend prior to the resumption of a bullish trend or bullish price swing. In other words, there is limited potential to the downside and greater potential to the upside.
Our previous Bitcoin analysis (BTCUSD) before the current price rally was also posted for FREE and can be found below.
https://coinanalyst.investments/2019/04/26/btc-analysis