
Introduction
This series of articles is intended to be a primer for the layman, to get started in predicting crypto and standard market assets focusing on a short list of tools with emphasis on Cindicator Hybrid Intelligence platform. It may seem overwhelming at first, but with a little research and observation, you can increase your proficiency in predicting assets significantly. This, in turn can help your trading.
I would like this to serve as the basis for community documentation for developing best practices for understanding markets using the tools currently available to us. Creating techniques for prediction and trading, and for answering questions on the Cindicator platform. I happily welcome any suggestions or additions, and if you feel I have missed, or misstated something, please find the contact information at the end of the document and let me know.
If you have not done so, I suggest you get familiar with the Cindicator platform, as it will be a primary source of examples throughout the text. You should take time to register and set up an analyst account, and be aware of the difference between crypto/stock markets in a very general way. If you own some crypto, have looked at charts in the paper or on the Internet from time to time, great! If you have not completed these steps, please visit the Cindicator page, and get started.
I am not an analyst by trade. I am a musician - a blues/rock guitarist, an artist, a writer - just about as far from the FinTech industry as a person can get; yet I have consistently managed to stay in the top 400 predictors, with an average accuracy of 78% for the last 4 months. At the time of writing I am 273/163 for monthly/all time in analyst ranking. I have not done this by trickery, gaming the system or answering very few questions. Instead, I have developed some simple methods - a sort of shorthand psuedo TA - that usefully lets me predict a variety of market movements. All that is required is a little time, effort and observation.
For many years, the bulk of data concerning prediction has been the domain of mathematicians, and statisticians. But that is not where it begins. The human mind is unique in the animal world in its abilities to extrapolate from the present to predict the future. This quality, along with tool use, and a handful of other traits, are what separate us from the majority of Animalea. When a spear is thrown into a stream, taking seconds to reach a fish, it is our ability to predict that guides it home. While scientists have mainly taken over the dialogue on prediction - take a moment to think of the complex ways you utilize your predictive ability in your day to day life and realize the math merely describes a process that every normal human is endowed with at birth. In just the same way practice and experience make a fly rod toss, or a baseball swing perfect - so can we train our innate predictive and intuitive abilities for charting, which tie directly into the other skills needed for trading successfully.
“But wait!” you might say, “Effort and observation are hard, and time is limited! Why would I want to spend my time learning to predict crypto, much less enter these predictions on a platform?” The first, and most easily explained reason, is monetary compensation. Analysts on the Cindicator platform are given ETH every month based on the accuracy of their predictions. The more accurate the predictions, and higher your rank, the more ETH you earn. Usually I earn somewhere between 10 - 20$ monthly for my efforts. It’s not going to pay my bills, but it’s always nice to get extra ETH.
The other benefits are more intangible, but arguably more valuable. First is the echelon system - those who place in the top 110 receive access to various levels of Cindicator analytical products for the next month scaled by rank. Additionally, you get the invaluable experience of making calls and watching market movements day in and out in a way that challenges you, but does not risk your actual assets, similar to paper trading, but with daily challenges to engage you. Cindicator predicting has been integral in getting me to a place where I feel comfortable trading in the real world, and the skills I have learned are helping take me to a level where I feel stable in my ability to navigate the crypto exchanges.
For those who do not yet feel comfortable, getting this type of familiarity is a frustrating and costly experience, each false step eating away at the available capital. The consequences of trading without experience can be dire; predicting on Cindicator develops excellent practices for trading, such as looking at charts daily, considering trends of popular assets, being aware of trends in key market assets, understanding the common ways that assets of different types move, and predicting range of movement in assets. Some people pay top dollar for this kind of information, the Cindicator platform can help you generate it yourself, and if you are good - it pays you!
Additionally, for token holders, becoming a part of the ecosystem should be on your agenda. The more we improve ourselves and our knowledge as analysts, the more accurate the system will become, which in turn will improve the value of the token. It's up to all of us to help accrue the largest data set possible. And last, but not least - there is my pet project - improving the accuracy of the machine learning models, as I detail in my last article, for the sake of mankind and the creation of a general science of predictive analytics.
Let’s get into the platform itself, and start by looking at the types of questions, and discussing some general strategies pertaining to them.You will see a lot of different types of questions, some that you may have asked yourself - so take time to read, and learn all you can. Remember, you are penalized for incorrect data (it's a lot nicer losing points on an app, than money in real life), so you should focus initially on getting your accuracy up for the assets and questions you feel most comfortable with, and work out strategies for the other question types from there, taking on new challenges as you improve your core skills. I will go over each type of question of the platform, and discuss the techniques I have found helpful in answering them. Some I still am not good at, and would appreciate feedback in developing methods for answering.
A last quick note on the interface: Questions are marked in app with a B or a $ sign to the left of the "time left to answer” box. The mark designates whether the question is about a crypto or standard market asset, respectively. To the right of the time box is an alarm bell icon, which allows you to set a notification to go off 30 minutes before the question closes.
Throughout this guide, there are common terms linked to articles to help you understand the concept. If you do not understand a concept, take time to read and learn it about it. There is also a brief glossary of these terms at the end of the document.
Binary Questions
In addition to the two types identified in the freshdesk documentation, we also have Bull/Bear questions, which will be discussed at the end of the section.Binary questions are questions that only have two possible answers: yes or no. You answer by giving a 0–100% probability of an event happening. A 0–49% probability is interpreted as a negative answer with various degrees of confidence, while a 51–100% probability is interpreted as an affirmative answer with various degrees of confidence. A conditional binary question is a question that asks “If event A happens, will event B also happen?” For example: “If NEO trades above $25 by 30 August, will NEO also trade above $35 by 10 Sep?“ NEO would have to reach $25 by August 30, or else all predictions would get a 0 score. Therefore, you have to predict the likelihood of the second event happening (NEO above $25) and it will only be counted if the first event happens as well.
Binary questions are the bread and butter of the app, and took me quite a while to get good at them.This type of question most generally asks you to identify a micro or macro trend in a given timeframe. At the core of my problem with the binary questions, is that it took me a while to notice that they most often are tied to a date. I was used to doing predicting on daily spot movements, and failed to take into account the extended time line necessary for the binary questions. Often times the binary questions cover a period of approximately 3 days - 1 week, which is usually enough time for a trend to change. You have to remember - what goes up must come down, and vice versa, use the section at the end for tips and tools for identifying trends to get some ideas of different ways to approach the problem.
The scoring for the binary questions is simple, scaled to the % given as input, with a maximum of +/- 50, by subtracting from the percentage given, IE “Will Bitcoin’s price rise to $6,500 by 30th July?” If the correct answer is “no” (= 0%), and the forecaster input a 65%, they will lose 15 points (50 - 65). A forecaster who answers 20% to this question will get 30 points (50 - 20) for the right answer.
My current process for the binary questions goes like this: read the question and find the price level it asks about, noting carefully the date which the binary closes, and whether 50 + is affirmative or negative in the context of the question. Then, I go look at the 1D charts provided, and trace back the same number of days as I will be predicting. Past behaviour does not necessarily predict future, but you can be reasonably sure that most of the time it will be along the same lines, or at least complete the current trend. If I need further clarity, I will consult the 4H, 30M, or 1H charts as well.
I identify what I most logically think will happen, and it amounts to one of five options:
- a steady rise
- a steady fall
- a rise with subsequent falling retracement
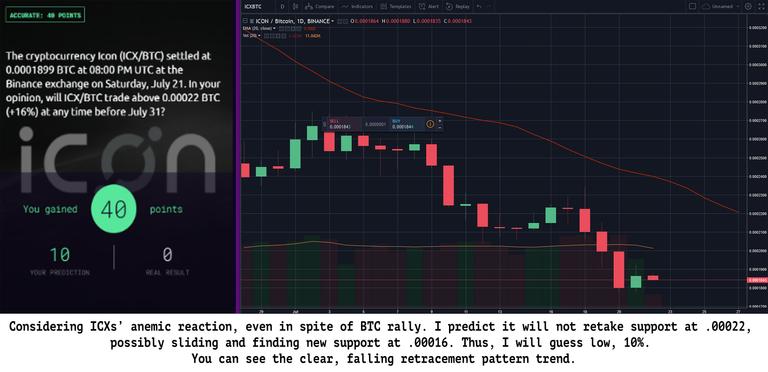
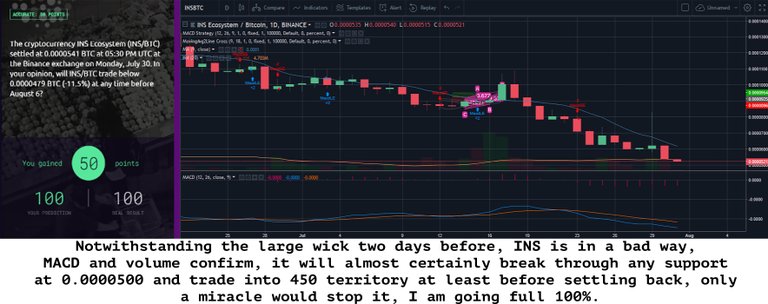
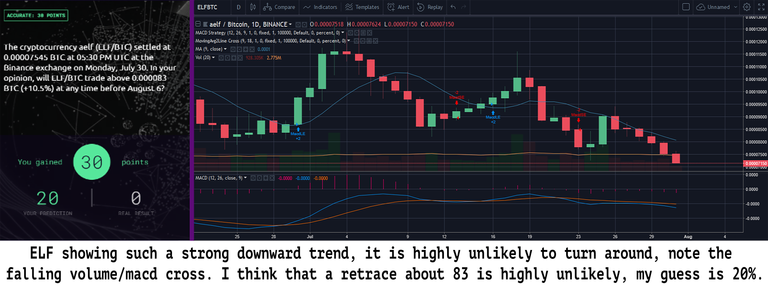
- a fall with subsequent retracement upwards, or a complete break in trend, which what would be referred to as a Black Swan Event. If I get an inkling of such a massive reversal coming, I wait for the market to settle down, and watch for some clarity to emerge from the patterns. Here are a few examples, including my real life sentiment notes from the time in question
7/22/18
- BTC relatively stable at 72 - 7400 following rally on 16th and 17th. ETH also seems to have found support (value not given).
I skipped a VET question because the charts seemed highly manipulated, not good to predict.
7/30/18
- There has been a sideways, slow bleed going on. ETH/BTC and most assets seem to be continuing on the same waning trend, BTC 8180 to 8080, ETH took quite a slide, 480 down to 444.
Bull/Bear Questions
Let’s take a moment now to go over the properties of bull/bear questions. Added recently, bull/bear questions are ultimately a more simple form of binary question in that there is no date attached to the outcome. It is only a matter of which condition will be satisfied first. Therefore, the best input will be given by identifying the overall trend of the asset.
It may be useful to look at the shorter charts to see how they are trending, as they tend to be sort of a fractal subset of the larger trend. For further assistance identifying trends, refer to the additional resources at the end of the document. Also remember it may be of use to research candlestick chart patterns for additional insight into how a trend may change.
Here is one example to consider:
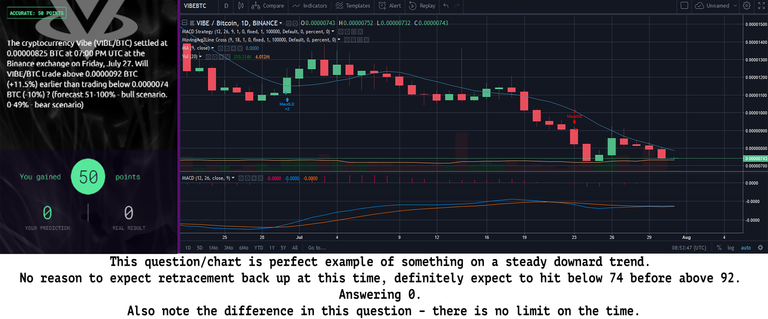
In summation, you give best input to the binary questions by correctly identifying whether the current trend will persist, given the time limit or lack thereof. At the end of the day, the markets can be fickle, and your best efforts may not succeed. Remember - try your best to scale your answer to your level of confidence. If the pattern you see is uncertain, let that be reflected in your percentage. Better to lose 10 points on a chart with an unclear direction than 50! Be aware of the wording of the question. I have lost a few points because I didn't clearly read what the question wanted - which direction meant what, or whether the asset was + or - a percentage. THE WORDING MATTERS, READ CAREFULLY.
Why Do I Have To Predict in Satoshis?
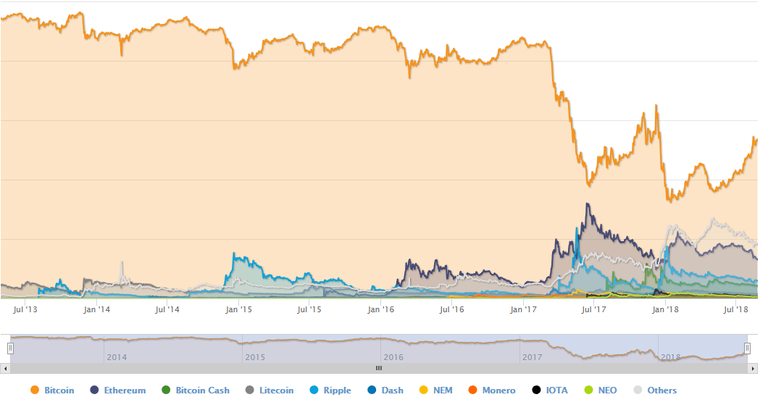
This is a common question, and a fair one. It also has a good explanation. Very few crypto assets have common fiat pairings, and as such, BTC is typically what one must trade to in order to get money OUT of the crypto space. Consider this - say you purchased X coin at .0004 BTC (approximately 2.58 US at this time), if you hold this coin, and attempt to trade or manage your account by it’s comparison to USD, when you go to sell it, what are you going to do? It may be worth 10$ US a coin, but if the only place you have to sell it is an exchange, for other crypto, then all of a sudden the only thing that matters is its relation to BTC. When you sell that coin, you may find it only worth .0005 BTC, as the value against BTC and USD are seperate. While a few exchanges do have offramps to FIAT, it is almost exclusively through BTC. Thus when you sell that 10$ USD coin, you almost certainly have to sell it to BTC first. Also - the people trading on the exchanges trade in BTC, not USD or RUB, so the support/resistance numbers tend to fall on BTC whole numbers. For all these reasons, it is much easier/better to predict against BTC value instead of a fiat currency.
Also, let’s take a minute to understand Satoshis. A satoshi is the lowest subdivision of a BTC, much like a cent to USD. BTC has 8 decimal places. Because it is highly valuable, most purchases you make in BTC are WELL under 1. thus it is common to see things like .00000070 value per coin etc. The way you verbalize and think of this, is by eliminating the insignificant digits - thus:
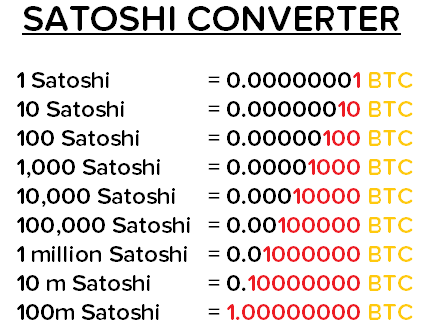
Ultimately, it is the standard unit of measurement within the crypto market, and as such, should be learned intimately by anyone who is serious about crypto trading and predicting, especially when BTC is the gateway coin between fiat money and all other cryptocurrencies.
Glossary of Terms
Bull/Bear
Terms in general use since far before the era of crypto trading. I think it’s worth putting the clearest definition, numbers 2 - 4 from the Dow Theory of Technical Analysis:
- The ‘market’ meaning the price of shares in general, swings in trends which may be major or primary, secondary and minor. The primary trends are the extensive up or down movements which generally last by 20% or more. Movements in the direction of the primary trend are interrupted at intervals by secondary swings, in the opposite direction. Finally, the secondary trends are composed of minor trends or day-to-day fluctuations which are unimportant.
- So long as each successive rally or price advance reaches a higher level than the one before it, and each secondary reaction, or price decline, stops at a higher level than the previous one, the primary trend is up. This is called a ‘bull market’.
- When each intermediate decline carries prices to successively lower levels and each intervening rally fails to bring them back up to top level of the preceding rally, the primary trend is down and that is called ‘bear market’.
Market Sentiment
“Market sentiment is the overall attitude of investors toward a particular security or financial market. Market sentiment is the feeling or tone of a market, or its crowd psychology, as revealed through the activity and price movement of the securities traded in that market. In broadest terms, rising prices would indicate bullish market sentiment, while falling prices would indicate bearish market sentiment.”
Retracement
“A retracement is a temporary reversal in the direction of a stock’s price that goes against the prevailing trend. For example, a retracement in an uptrend is a brief period of selling before the uptrend continues, also known as a dip.”
- https://www.investopedia.com/terms/r/retracement.asp
- https://www.investopedia.com/ask/answers/05/fibonacciretracement.asp
Support/Resistance
“Support is the price level at which demand is thought to be strong enough to prevent the price from declining further. The logic dictates that as the price declines towards support and gets cheaper, buyers become more inclined to buy and sellers become less inclined to sell. By the time the price reaches the support level, it is believed that demand will overcome supply and prevent the price from falling below support.
Support does not always hold and a break below support signals that the bears have won out over the bulls. A decline below support indicates a new willingness to sell and/or a lack of incentive to buy. Support breaks and new lows signal that sellers have reduced their expectations and are willing sell at even lower prices. In addition, buyers could not be coerced into buying until prices declined below support or below the previous low. Once support is broken, another support level will have to be established at a lower level.
Resistance is the price level at which selling is thought to be strong enough to prevent the price from rising further. The logic dictates that as the price advances towards resistance, sellers become more inclined to sell and buyers become less inclined to buy. By the time the price reaches the resistance level, it is believed that supply will overcome demand and prevent the price from rising above resistance.
Resistance does not always hold and a break above resistance signals that the bulls have won out over the bears. A break above resistance shows a new willingness to buy and/or a lack of incentive to sell. Resistance breaks and new highs indicate buyers have increased their expectations and are willing to buy at even higher prices. In addition, sellers could not be coerced into selling until prices rose above resistance or above the previous high. Once resistance is broken, another resistance level will have to be established at a higher level.”
- Technical Analysis of Stock Trends, Vol 10, Macgee and Edwards
- https://www.investopedia.com/trading/support-and-resistance-basics/
Trends (identifying)
“The trend is the general direction of a market or of the price of a security. In technical analysis, trends are identified by trendlines that connect a series of highs or lows. Most traders trade in the same direction as a trend, while contrarians seek to identify reversals. Trends can also apply to interest rates, bond yields, and other markets where they’re characterized by a long-term movement in price or volume.”Candlestick Chart
“Just like a bar chart, a daily candlestick shows the market’s open, high, low and close price for the day. The candlestick has a wide part, which is called the “real body.” This real body represents the price range between the open and close of that day’s trading. When the real body is filled in or black, it means the close was lower than the open. If the real body is empty, it means the close was higher than the open.” These are the standard charts you see an all forex and crypto exchanges. They are preferred by traders and predictors to the standard line chart because they convey more information. Of particular note is the time period. You will note in the top left corner of the tradingview display, there is a box that says 1D (typically). You will find this same box on binance and most crypto excahgne windows. If you click it, you can change the period. 1D means one day. You can change it to 1 hour, 4 hours, 1 week. The important thing to remember is that whatever you set it to, each candle represents one of those periods.Technical Analysis
“Technical analysis is a trading discipline employed to evaluate securities and identify trading opportunities by analyzing statistics gathered from trading activity, such as price movement and volume. Unlike fundamental analysts, who attempt to evaluate a security’s intrinsic value, technical analysts focus on charts of price movement and various analytical tools to evaluate a security’s strength or weakness.”Black Swan Event
“The black swan theory or theory of black swan events is a metaphor that describes an event that comes as a surprise, has a major effect, and is often inappropriately rationalized after the fact with the benefit of hindsight. The term is based on an ancient saying that presumed black swans did not exist – a saying that became reinterpreted to teach a different lesson after black swans were discovered in the wild.”Machine Learning
“Machine learning is a field of computer science that uses statistical techniques to give computer systems the ability to “learn” (e.g., progressively improve performance on a specific task) with data, without being explicitly programmed.”
Predictive Analytics
“Predictive analytics encompasses a variety of statistical techniques from data mining, predictive modelling, and machine learning, that analyze current and historical facts to make predictions about future or otherwise unknown events”
Books
- Technical Analysis of Stock Trends, Tenth Edition Magee and Edwards
- Elliott Wave Principle: A Key to Market Behavior
- Candlestick Trading Bible
Tools
- https://athda.com - All time high data
- https://www.coinmarketcap.com/ - your new bible
- https://www.tensorcharts.com/ - excellent charting w/heat map functions
- https://coinfarm.online/index.asp - lot of useful information, including long/short option statistics on bitmex
- https://blockchainwhispers.com/bitmex-position-calculator/ - slightly off topic, useful for leveraged trading
- http://www.coindominancecharts.com/ - useful for rank questions
- http://data.bitcoinity.org/markets/books/USD# - Various order books
- https://agile-cliffs-23967.herokuapp.com/binance - Volume indicator for binance, leave it open for a second and data will start to accumulate
- https://www.tradingview.com - get a membership
- https://www.cryptopanic.com - best sentiment / news aggregator
- https://t.me/cindicator_chat - Cindicator Telegram link
- https://t.me/cryptiverse - Cryptiverse Chat Channel link
Reading
- https://www.hussmanfunds.com/content/comment/ - lots of good commentary, mostly on standard markets but even handed and insightful
- https://www.binance.vision/ - binance educational page
- https://stockcharts.com/school/doku.php?id=chart_school - lots of information on charts, terms etc.
- https://telegram.me/joinchat/AAppPT3cOnM48-Kqbm7FGg - traders library chat channel
- https://www.tradingview.com/ideas/indicator/ - tradingview explains indicators
- https://www.investopedia.com/articles/active-trading/041814/four-most-commonlyused-indicators-trend-trading.asp - another indicator explanation page
Please remember to like and share! Follow me on twitter @mithseraphi or on steemit: https://steemit.com/@seraphismith Please send any suggestions to one of these accounts!
Be on lookout for upcoming articles from Cindicator community members on utilizing indicators in trading! Come talk predictions on Cindicator Telegram: https://t.me/cindicator_chat
PART 2 COMING SOON!

Congratulations @seraphismith! You have completed the following achievement on Steemit and have been rewarded with new badge(s) :
Click on the badge to view your Board of Honor.
If you no longer want to receive notifications, reply to this comment with the word
STOP