BREAKOUT.
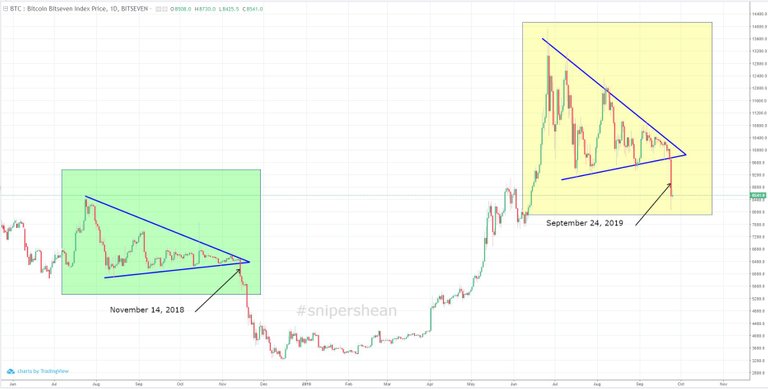
Yesterday, a bearish daily candle broke the descending triangle pattern of the BTC/USD market.
History tells us that the same thing happened in 2018.
Bitcoin is riding a descending triangle pattern from July 25-November 13.
Then on the next day, November 14, 2018, a bearish candle suddenly developed hence breaking the pattern.
Due to this movement, Bitcoin's value plummeted from $17000 to $3000.
It stayed there for quite some time until it made a bull run leading to a 14k price tag in June 2019.
Now the questions.
Will BTC have the same fate?
Are we going to see a new low before the year ends?
If he does, for how long is he going to stay at the bottom?
When will the possible bull run take place?
Answers will be revealed in the coming days.
Just watch and see how history unfolds.
SniperShean