
#Analysis
🔴 Hey guys let's make a brief analysis of every single indicator, trends & pattern to deeply understand the market situations.
📌 We'll include only popular and most efficient tools not all of them, and we'll calculate the rating of every analysis between buy and sell signal and give them ratings out of 10.
📌 Finally we'll calculate all the points of Buy & Sell signal to get an average result.
📌 So let's begin👍

🔴 So let's start with my personal best and the most popular indicator for analysis, Moving Averages.
📌 This chart 👆 is clearly showing that moving averages are strongly supporting for a buy signal.
📌 Although 300 & 500 are still bullish in long term so if you're planning to hold for more than a year than that's a good opportunity.
📌 But 100 SMA and & 21 EMA are strongly showing a sell signal.
📌 200 SMA is not so aggressive but now its also indicating for a sell signal.
📌 Conclusion : Buy 2 points, sell 8 points from Moving Averages
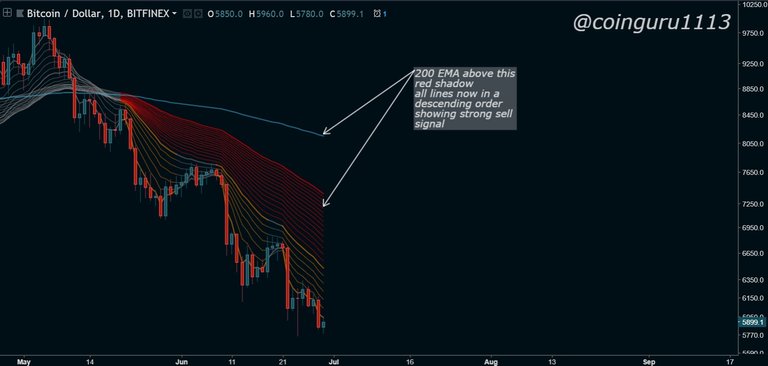
🔴 One of the most popular MA indicator Super Guppy👆 is also showing strong bearish sentiments.
📌 All lines are now in a descending order.
📌 Conclusion : Buy 1 point, sell 9 points from Super Guppy
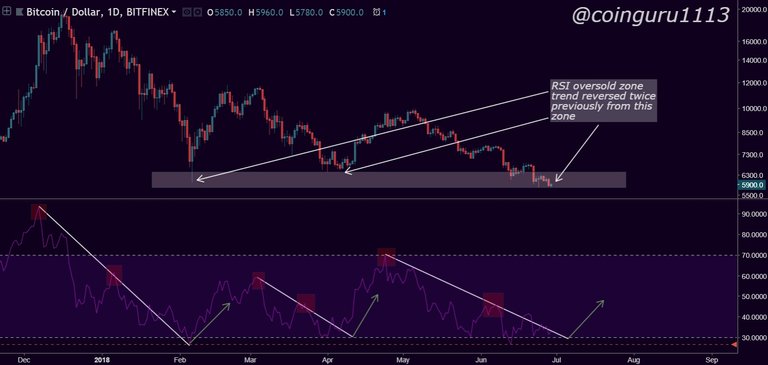
🔴 RSI is continue showing momentum getting lower and lower from last 30 days.
📌 In this chart 👆 RSI has followed the trend line so accurately in last 6 months.
📌 You can see that how prices respects the levels of RSI trend in support and resistance.
📌 Currently we're so close to hit the bottom and can see a breakout anytime according to tge RSI.
📌 Conclusion : Buy 7 points, Sell 3 points from RSI
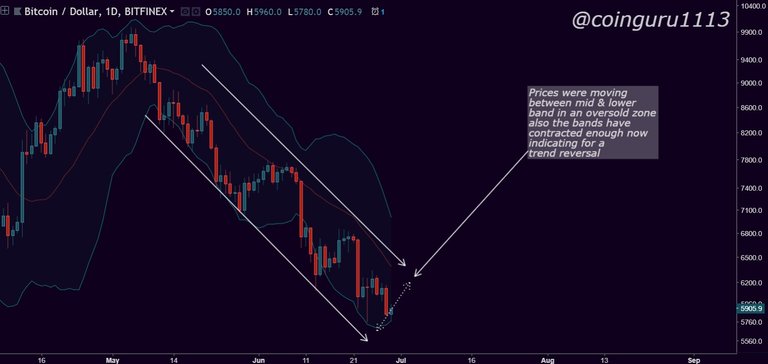
🔴 Bollinger Bands are contracted enough now, its like a rubber band more you stretch it, it takes more power for you to keep hold and stretching it.
📌 That's what happens with prices, its getting so hard now for bears to keep the prices lower, so probably soon bands gets explode with a reversal.
📌 Also we're in a oversold zone of Bollinger bands so there's a high probability for a reversal.
📌 Visit https://www.investopedia.com/articles/technical/102201.asp to know more about Bollinger bands
📌 Conclusion : Buy 8 points, Sell 2 points from Bollinger Bands
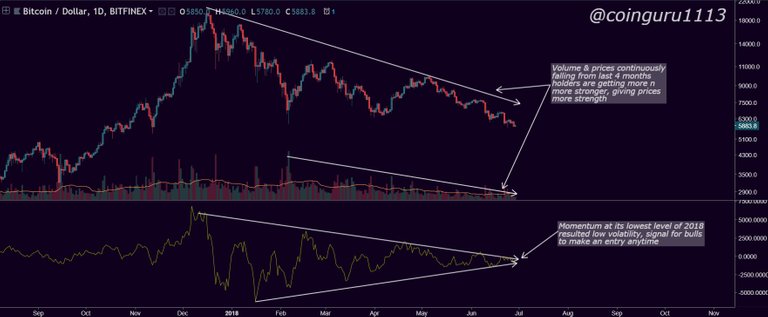
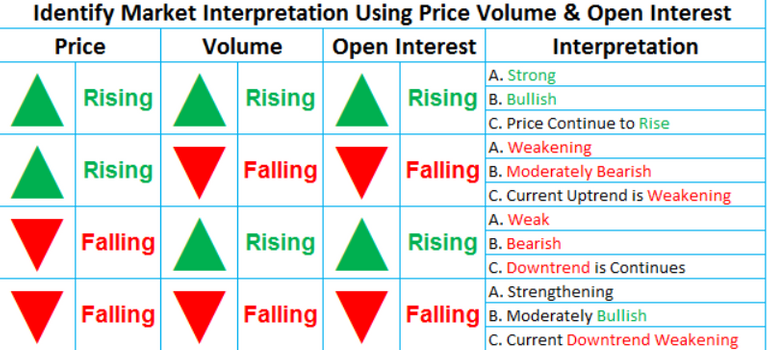
🔴 Next indicator is Volume and Momentum.
📌 Clearly you can see in the chart👆 above how volume and prices both are going down from last 4 months, which resulted low volatility in market.
📌 This has filtered short and mid term traders from crypto space and now more than 60-70% are long term holders, which are strong and hard to break for bears.
📌 Obviously low prices and low volatility (volume and Momentum) strengthens the market for the next rally.
📌 Visit : https://www.investtech.com/main/market.php?CountryID=44&p=staticPage&fn=helpItem&tbReport=h_PVC to learn more on this topic.
📌 Conclusion : Buy 6 points, Sell 4 points from Volume & Momentum
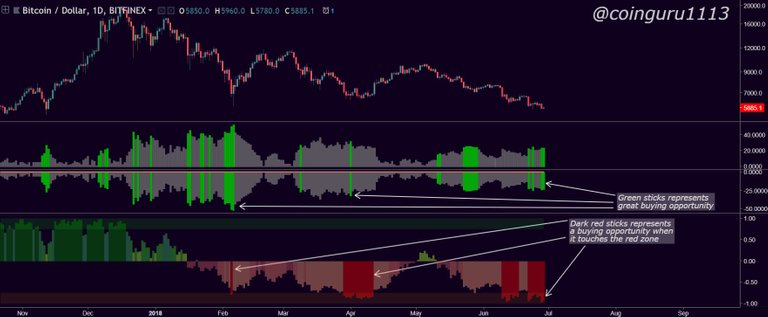
🔴 My personal best William's Vix Fix & Murrey's Oscillator indicating for a buying opportunity as shown in chart 👆
📌 Conclusion : Buy 6 points, sell 4 points
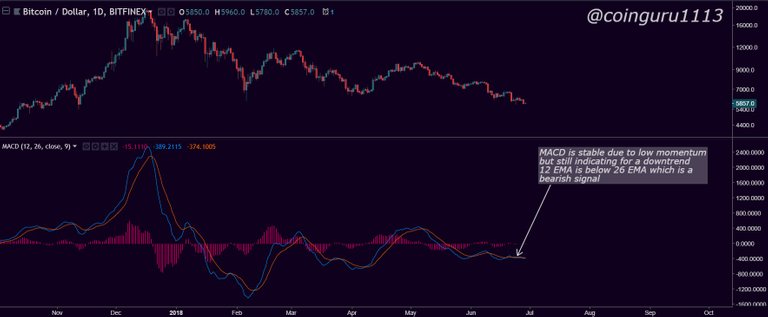
🔴 It's clear that MACD will walk with Moving Averages, so as expected its showing for a downtrend, but almost stable from last 20 days👆
📌 Conclusion : Buy 4 points, Sell 6 points
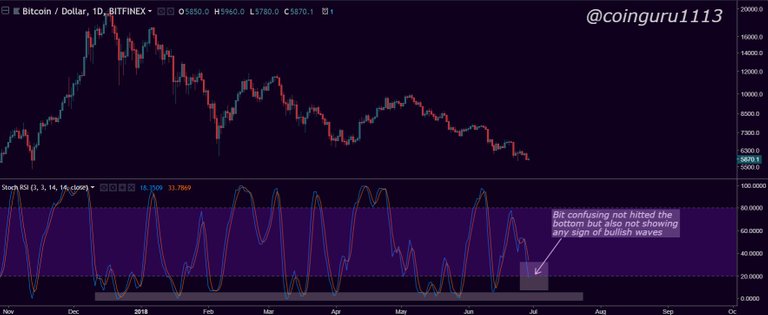
🔴 Stoch RSI is giving a little bearish sign but not so strong which makes it bit more confusing.
📌 Visit : http://stockcharts.com/school/doku.php?id=chart_school:technical_indicators:stochrsi to learn more about Stoch RSI
📌 Conclusion : Buy 5 points, Sell 5 points
🔴 OK that's enough now with indicators let's move to trends and patterns now.
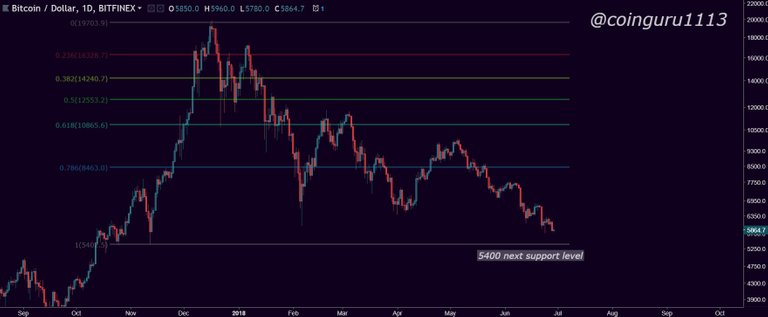
🔴 Clearly undebatable fib is showing 5400 as the next support level which is not so far, although fib levels are not a guarantee but we must understand that in today's trading world Fibonacci levels are so noticeable.
📌 Conclusion Buy 3 points, Sell 7 points
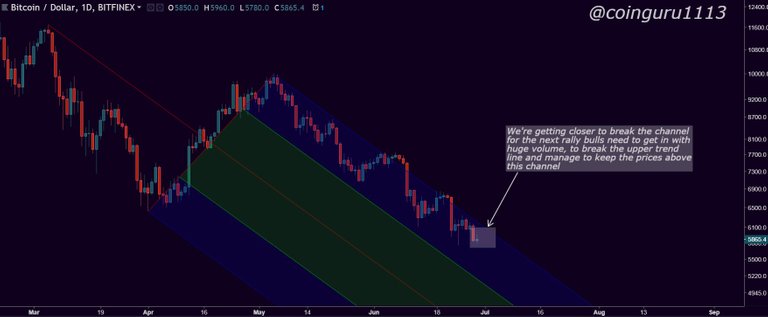
🔴 Looks like we're getting closer for a breakout, but we can also follow this channel by going lower.
📌 Although pitchfork channels are quite confusing to draw, but they provide a nice channel for price trend.
📌 Here http://stockcharts.com/school/doku.php?id=chart_school:chart_analysis:andrews_pitchfork you can read more about this.
📌 Conclusion : Buy 6 points, Sell 4 points
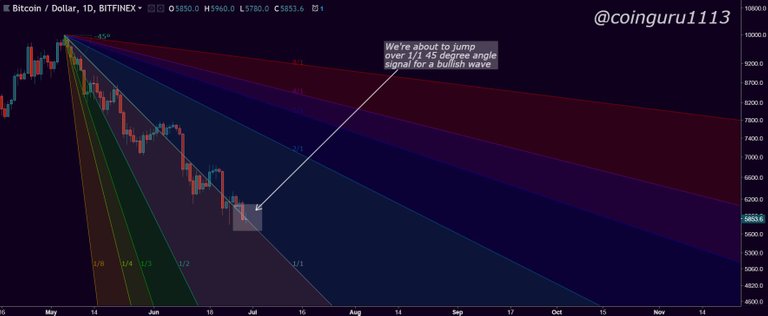
🔴 Gann fan is also quite confusing tool but used widely to know the trend.
📌 the common theory for gann fan is that if the prices cross the 45° trend line also called 1/1 angle than probably its a bullish sign, and looks like we're about to cross that line.
📌 It's quite confusing for me too to use this tool, coz i don't use it normally.
📌 To learn more about Gann visit : https://www.metatrader5.com/en/terminal/help/objects/gann/gann_fan
📌 Conclusion : Buy 6 points, sell 4 points
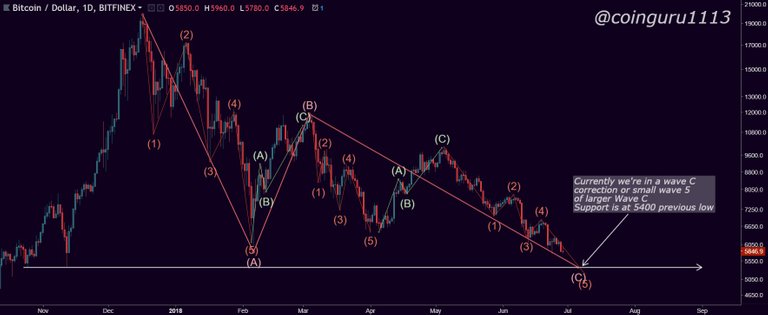
🔴 Now the Elliott Wave Theory is one of the strongest theory of price movements.
📌 In this chart 👆 you can see that currently we're in Wave C which is a long term correction wave, and in that wave C we're in wave 5 which could be the last dip for the correction Wave.
📌 Support for Wave C is at 5400 which is also previous low, so probably for now market can go a bit more lower from here according to this theory.
📌 To learn more about this visit https://www.investopedia.com/articles/technical/111401.asp
📌 Conclusion : Buy 3 points, Sell 7 points from Elliott waves theory
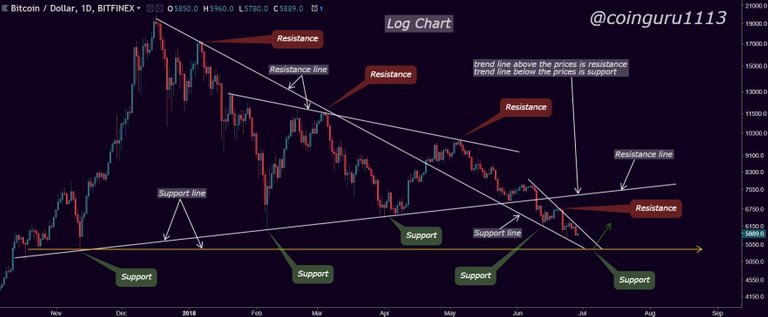
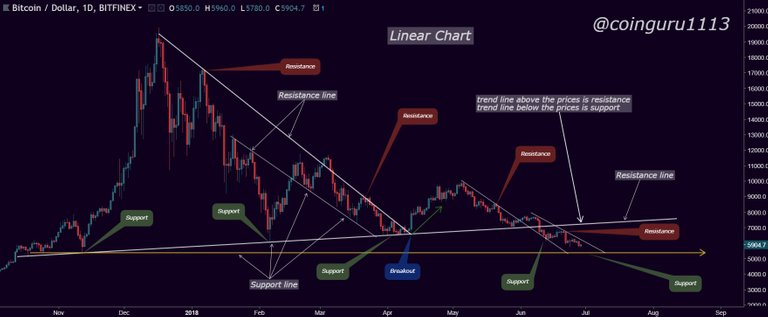
🔴 So how can we forget the trend lines, remember in trading trend is your friend, but till the end😉
📌 So above we have two charts first one is logarithmic and another one is linear.
📌 Two different charts coz trend lines works in this both differently, log charts are good for long term analysis, whereas linear are good for short or mid term.
📌 To study more about them visit https://www.investopedia.com/ask/answers/05/logvslinear.asp
📌 Now first thing about trend lines is that, when prices are below the trend than its a resistance level & when prices are above the trend than its support level.
📌 In above charts I've clearly shown how these trend lines works as a support and resistance for prices.
📌 Current trend is showing that Bitcoin could make a new bottom towards 5400 which has heavy support from 2017, but that doesn't mean this trend could not be broken, there's still a probability of a breakout from this channel, coz we're now so close to the support.
📌 To learn more about trend lines visit : http://stockcharts.com/school/doku.php?id=chart_school:chart_analysis:trend_lines
📌 Conclusion : Buy 4 points, Sell 6 points
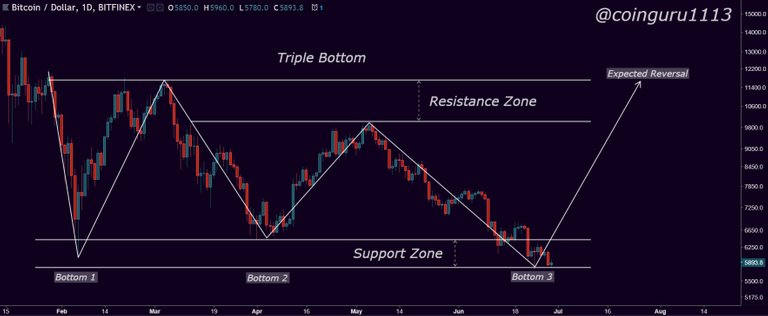
🔴 Now the triple bottom formation I've already described in this post 👉https://t.me/coinguru1113/5567 so i won't stretch it more.
📌 But according to this pattern we're just sitting on a breakout.
📌 to know more about this pattern visit : https://www.investopedia.com/terms/t/triplebottom.asp
📌 Conclusion : Buy 7 points, Sell 3 points
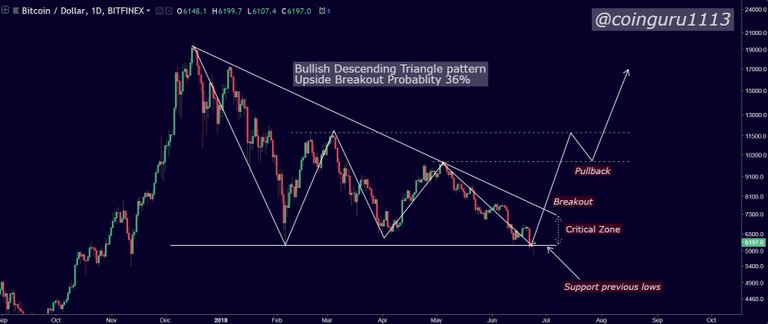
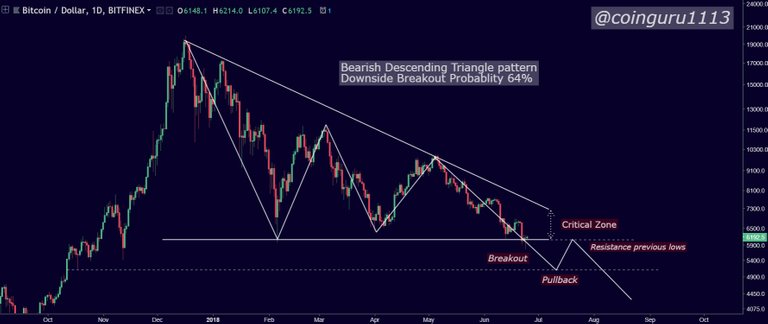
🔴 Descending triangle patterns are also mentioned in this post 👉https://t.me/coinguru1113/5644, so this one also no need to explain briefly.
📌 Success rate of this pattern is 72.93% (source : https://samuraitradingacademy.com/7-best-price-action-patterns/)
📌 Whereas Upside breakout chances are 36% and breakdown chances are 64% (source : http://www.finvids.com/Chart-Pattern/Triangles)
📌 Conclusion : Buy 3 points, Sell 7 points from Descending triangle pattern
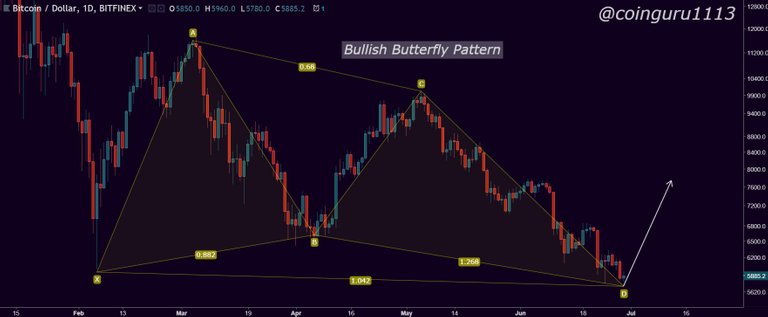
🔴 This chart👆 is showing for a Bullish Butterfly pattern. Pattern is pretty complicated but it does apply in price actions.
📌 Here (https://www.investopedia.com/articles/forex/11/harmonic-patterns-in-the-currency-markets.asp) you'll find a detailed article related to this pattern.
📌 Although pattern do not follow the exact numbers explained in its theory, so we have to be bit more flexible when applying this.
📌 Here an another article to understand you better (http://www.profitf.com/articles/forex-education/harmonic-pattern-butterfly/)
📌 Conclusion Buy 6 points, Sell 4 points from Butterfly pattern
🔴 So towards the end let's get an final average results👍
🔴 Results
📌 Moving Averages : Buy 2, Sell 8
📌 Super guppy : Buy 1, Sell 9
📌 RSI : Buy 7, Sell 3
📌 Bollinger Bands : Buy 8, Sell 2
📌 Volume : Buy 6, Sell 4
📌 Williams & Murrey's : Buy 6, Sell 4
📌 MACD : Buy 4, Sell 6
📌 Stochastic RSI : Buy 5, Sell 5
📌 fib : Buy 3, Sell 7
📌 Pitchfork : Buy 6, Sell 4
📌 Gann : Buy 6, Sell 4
📌 Elliott Waves : Buy 3, Sell 7
📌 Trend lines : Buy 4, Sell 6
📌 Triple Bottom : Buy 7, Sell 3
📌 Descending triangle : Buy 3, Sell 7
📌 Butterfly Pattern : Buy 6, Sell 4
🔰 Average Buy 4.8, Sell 5.2
📌 So its a very close battle but looks like Sell win this clearly. Hope this analysis helped you.
plz do upvote comment and share to support us
join our telegram channel https://t.me/coinguru1113 for crypto knowledge
🔰 Thankyou 🙏
Bull run is on the way husainabdul72 sir if you earn on steemit this is not right way

According to me this post has value more than 1500$ but you need to use paid service method to collect audience. you should use steembottracker to increase upvote. If you earn Maximum on steemit increase your system power by buying steem & Steem power so your account & upvote value more. Then people will upvote you & you are in trending post
I followed you on telegram both channels. You are awesome great to see on steemit
I am new on it but l learn from you
If you like me upvote & reply my post
Thank you
I have followed and upvoted you please do the same!