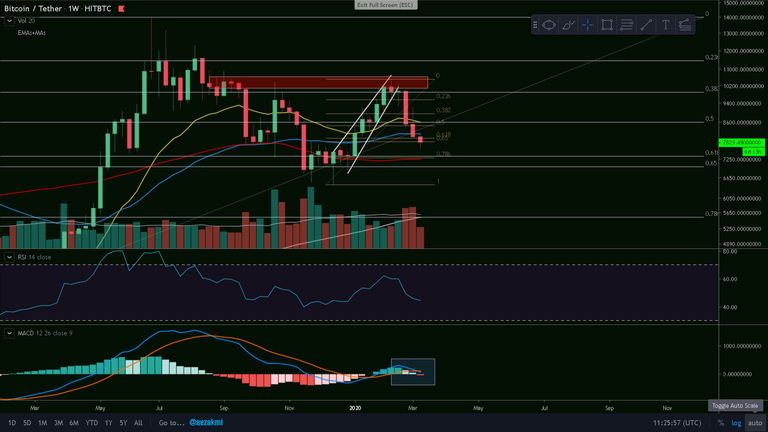
BTC/USD Weekly Chart
Bitcoin broke the weekly 55 EMA (blue) and is currently finding support at the golden pocket region of the small Fibonacci. Our next stop is the 7300$ (with possible wicks to 7000$), were a big support level is to be found: we have the 0.618 of the big Fib., the 0.786 of the small Fib. and the 100 weekly MA. There's also a bearish cross on the MACD, so 7300$ could be around the corner.
Ctrl + Click here to enlarge the image in a new tab (steemitimages)
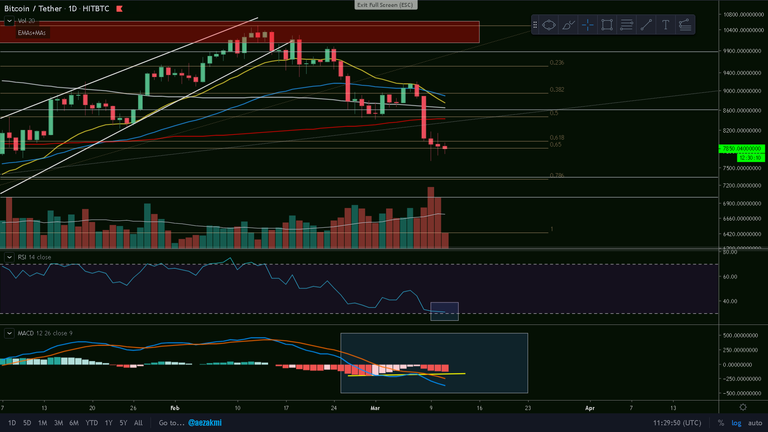
BTC/USD Daily Chart
On the daily, the descending channel is more clear. We have the RSI almost touching the lower reference line and despite the MACD rejection at the signal line, we have a bullish divergence on the Histogram, which might signal an early reversal. Personally, I'm still waiting for a divergence also on the RSI and MACD.
Ctrl + Click here to enlarge the image in a new tab (steemitimages)


Thanks for reading and safe trading!✌
If you find this post useful, please:

Update:
First target hit. Could have candle wicks as low as 7000$.Ctrl + Click here to enlarge the image in a new tab (steemitimages)
Update 2:
Second target hit
Ctrl + Click here to enlarge the image in a new tab (steemitimages)
Update 3:
Mentioned 5000-5500$ range as worst case scenario 6 months ago - Post is here
Don't think we're going to break the 200 weekly MA
Ctrl + Click here to enlarge the image in a new tab (steemitimages)
OK, that was ugly. First time we break through the 200 weekly MA so ugly.