In this episode, we will examine one of the popular chart indicators. Bollinger Bands
"Bollinger Bands" is an indicator which is simple to use and dependable.
I will try to explain as easily as possible.
Bollinger Bands
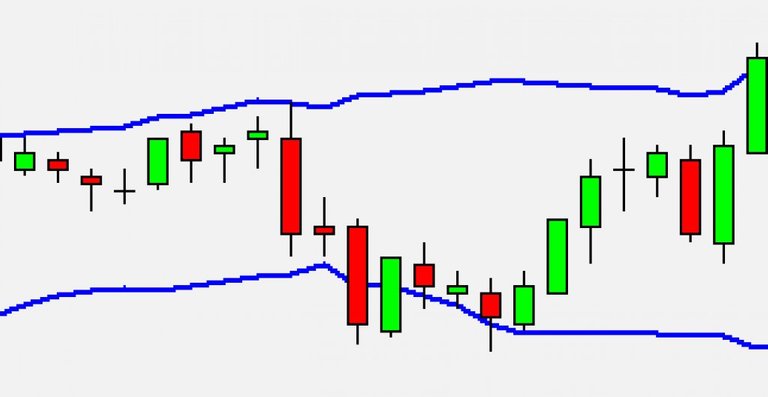
Bollinger bands are used to measure a market's volatility.
Basically, the bands tell us whether the market is quiet or loud.
- When the market is quiet, the bands contract ;
- When the market is loud, the bands expand.
 Onlinetradingconcepts
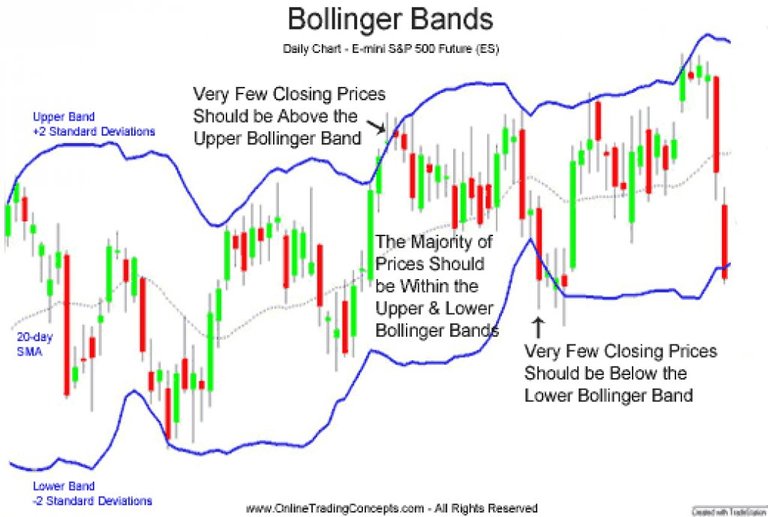
Bollinger Bands is a versatile tool combining moving averages and standard deviations and is one of the most popular technical analysis tools. There are three components to the Bollinger Band indicator:
Moving Average: By default, a 20-period simple moving average is used.
Upper Band: The upper band is usually 2 standard deviations (calculated from 20-periods of closing data) above the moving average.
Lower Band: The lower band is usually 2 standard deviations below the moving average.Onlinetradingconcepts
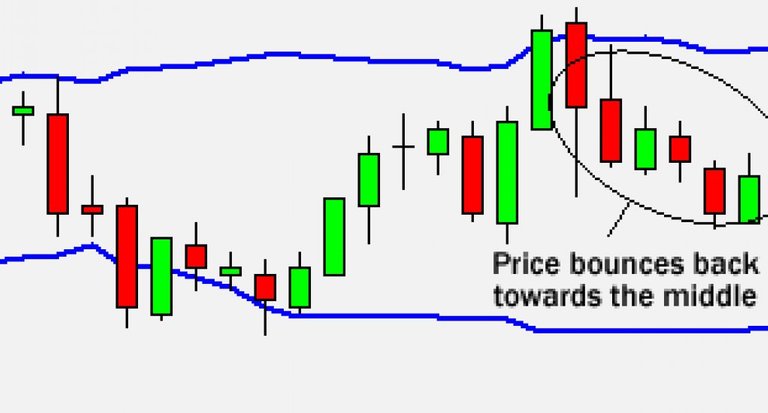
The Bollinger Bounce
The theory is that: Price tends to return to the middle of the bands. That's the whole idea behind the bounce.
The reason for a bounce is that: Bollinger bands act like dynamic support and resistance levels.
Some traders believe in that these bounces and the strategy is best used when the market is ranging.
Then
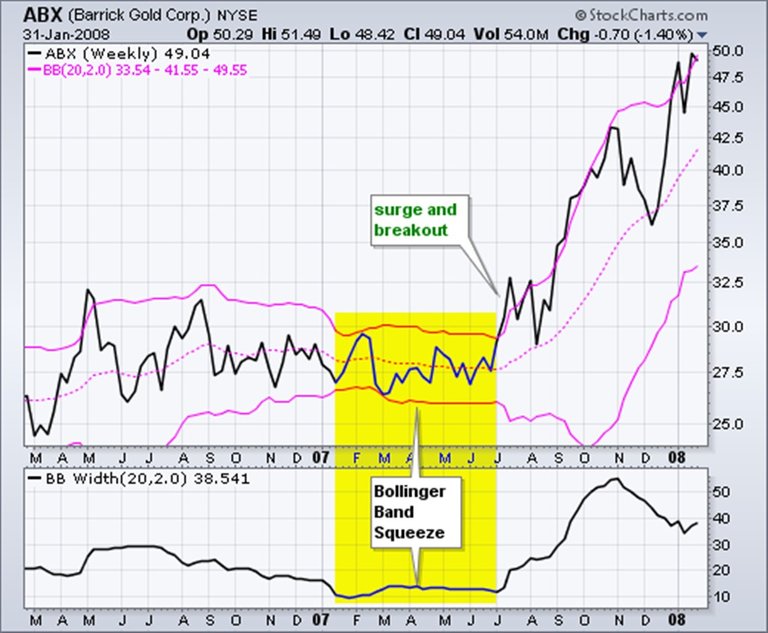
Bollinger Squeeze
Simply, when the bands squeeze together, it usually means that a break out is going to happen.
Stockcharts

Crypto-Education Series Episode 1
Crypto-Education Series Episode 2
Crypto-Education Series Episode 3
Crypto-Education Series Episode 4
Crypto-Education Series Episode 5
Crypto-Education Series Episode 6
TURKISH
Bollinger Bantları
Bollinger Bantları genel olarak marketin oynaklığının (volatility) ölmesinde kullanılır.
Temel anlamda, marketin durağanlığı ya da hareketliliği hakkında bilgi verir.
- Market sakinken bantlar sıkışır ;
- Market hareketli iken bantlar genişler.
Onlinetradingconcepts
Bollinger Sıçraması
Teoride, Fiyat iki ban arasındadır ve iki bandın arasına dönmeye meyillidir. Sıçrama fikrinin altındaki temel mantık bundan ibarettir.
Sıçramanın sebebi şudur: Bollinger bantları hareketli destek ve direnç noktaları görevi görür.
Bazı tacirler, sıçrama teorisinin ve Bollinger bandı taktiklerinin henüz yön tayin etmemiş (ranging) marketlerde en iyi sonuçlar verdiğini düşünür.
Ardından
Bollinger Bantlarında Daralma
Bollinger bantları birlikte daralma gösterdiğinde, bu genel anlamda bir güçlü çıkış (break out) yaşanacağının habercisidir.
Stockcharts
Hi! I am a robot. I just upvoted you! I found similar content that readers might be interested in:
https://www.babypips.com/learn/forex/bollinger-bands