Stochastic Oscillator
Stochastic was created by George Lane in the late 1950s.
It is a leading indicator, which gives the signals before they have actually occurred.
Even though it was first designed to follow the speed and momentum of price, it is now used to identify overbought and oversold conditions.
The stochastic oscillator is a momentum indicator comparing the closing price of a security to the range of its prices over a certain period of time.
The sensitivity of the oscillator to market movements is reducible by adjusting that time period or by taking a moving average of the result.
Investopedia
Sirforex
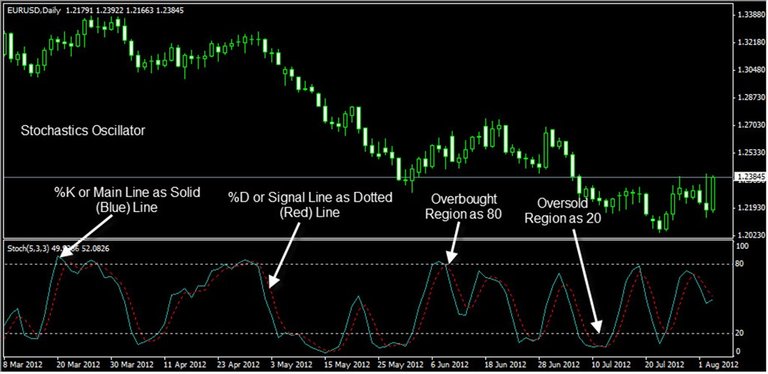
The Structure of the Stochastic
The Stochastic is scaled from 0 to 100.
The Stochastic consists of couple lines, which fluctuate in three areas.
These are an overbought, oversold, and a middle (neutral area).
 Cashbackforex
- When the lines are above 80, it means the market is overbought.
- When the lines are below 20, it means the market is oversold.
- One of the lines is faster than the other.
This way the Stochastic constantly shows crossovers, which are used as bullish and bearish signals which depend on the direction of the cross.

How to Use the Stochastic Oscillator
We can utilize Stochastic for four conditions. Let's check all of them.
- Overbought Conditions
- Oversold Conditions
- Crossover Situations
- Divergence
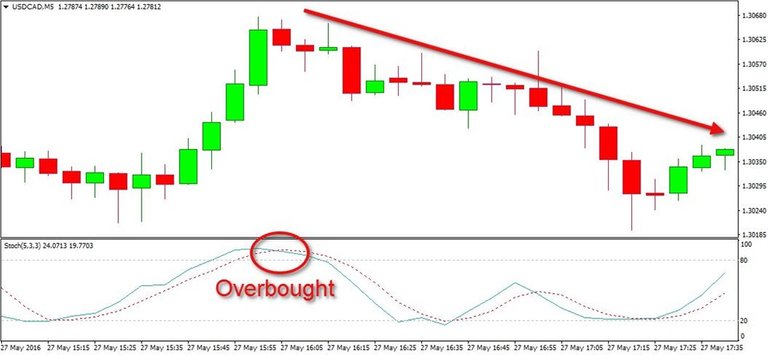
Overbought Conditions
The Oscillator gives overbought signals when the two lines are located in the upper zone(above 80). In an overbought situation, a correction is expected.
 Sirforex
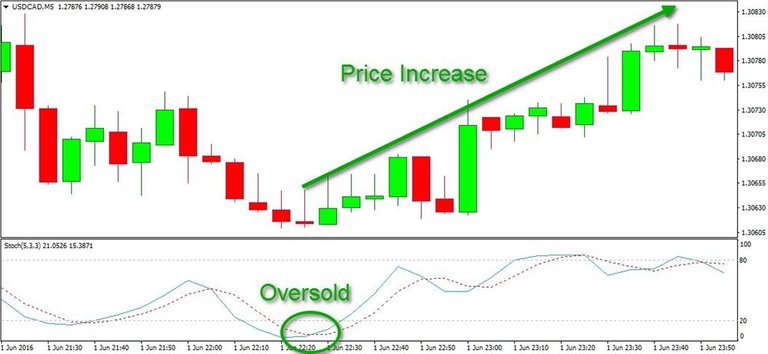
Oversold Conditions
The Oscillator gives oversold signals when the two lines are located in the lower zone(below 20). In an oversold situation, a break out is expected by many traders.
 Sirforex
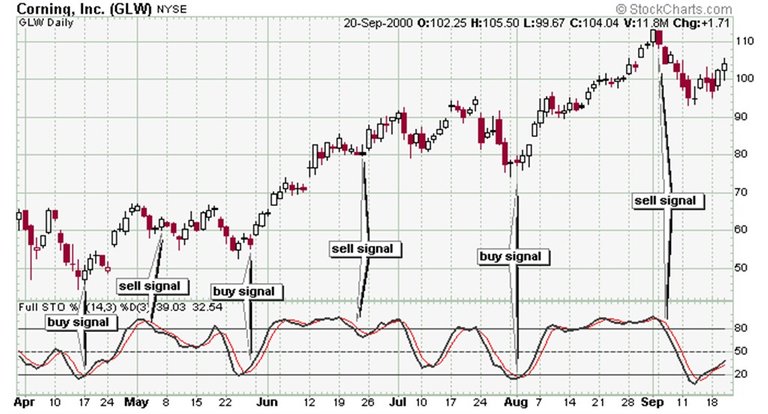
Crossover
When the two lines cross, we have a signal in the direction of the crossover. It depends on the direction of crossover to identify whether the crossover is a bullish or a bearish signal.
 leavittbrothers
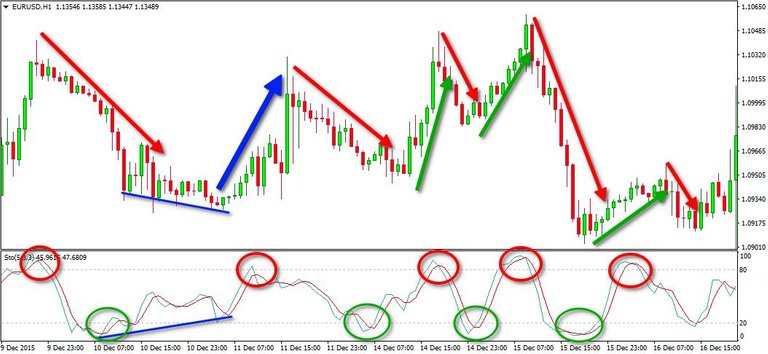
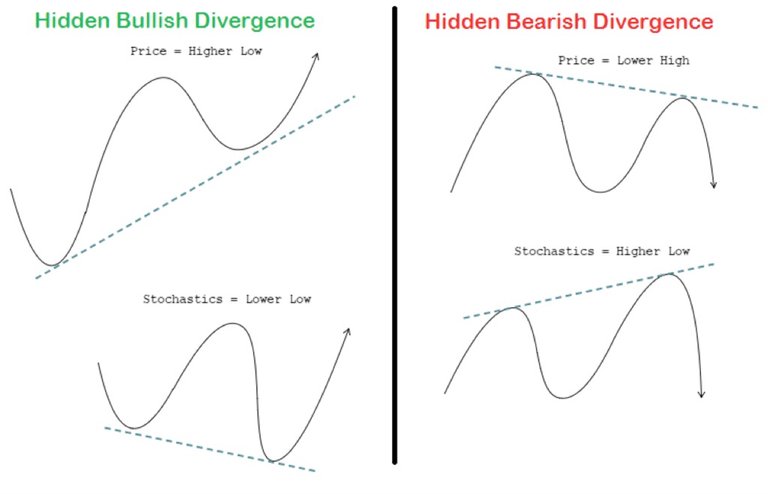
Divergence
- The divergence is a very useful and also important signal for traders. Divergences occur in many indicators and give traders an opportunity to take a position.
- We get a bullish divergence between the Stochastic and price action when the price is dropping and the Stochastic Oscillator is increasing.
- Contrarily, we get a bearish divergence between the indicator and the price action, when the price is increasing, whereas the Stochastic is decreasing.
Conclusion
the Stochastic Oscillator gives many signals. However, since the signals suppose the real event on the chart, the Stochastic Indicator success rate is relatively low.In that, we should always combine the indicator with at least an extra trading tool.
Crypto-Education Series Episode 1
Crypto-Education Series Episode 2
Crypto-Education Series Episode 3
Crypto-Education Series Episode 4
Crypto-Education Series Episode 5
Crypto-Education Series Episode 6
Crypto-Education Series Episode 7
Crypto-Education Series Episode 8
Crypto-Education Series Episode 9
TURKISH
Stochastic - Öncü Gösterge-
Stochastic, George Lane tarafından 1950'lerin sonlarına doğru geliştirilmiştir.
Bir öncü göstergedir, yani sinyalleri fiyat hareketlerinden önce kullanıcısına sunar.
Yapılış amacı fiyat hereketlerinin hızını ve ivmesini saptamak olsa da ; günümüzde aşırı alım ve aşırı satım durumlarını izlemek için başvurulur.
Sirforex
Stockastic Göstergesinin Yapısı
Stochastic 0 ile 100 değerleri arasında ilerleyen 2 tane yatay çizgiden oluşur.
Aşırı alım bölgesi (80 değeri ve üzeri) ; Aşırı satım bölgesi (20 değeri ve altı) ve Yön tayin etmediği orta bölüme sahiptir.
Cashbackforex
- Yatay çizgilerin 80 üzerinde seyir etmesi aşırı alım göstergesidir.
- Yatay çizgilerin 20 altında seyir etmesi ise aşırı satım anlamına gelir.
- Çizgilerden birisi diğerinden daha hızlı hareket ettiği için kesişimler her zaman meydana gelir. Kesişimler meydana geldiğinde, kesişmenin gerçekleştiği yön olası fiyat hareketi hakkında ipucu verir.
Stochastic Öncü Göstergesi Nasıl Kullanılır ?
4 temel durumda Stochastic'ten yararlanabiliriz.
- Aşırı alım
- Aşırı satım
- Kesişim
- Uyuşmazlık (fiyat ve göstergeler arası)
Aşırı Alım Durumu
İki yatay çizginin 80 ve üzeri bir değerde yer alması, göstergenin aşırı alım sinyali vermesi anlamına gelir. Genel durumda, bir düzelme beklenir. Düzeltmeler fiyatların aşağı yönde seyir etmesine denir.
Sirforex
Aşırı Satım Durumu
Yatay çizgilerin 20 ve altı bir değerde seyir etmesi, göstergede aşırı satım olduğunun sinyalini verir.
Aşırı satım durumunda, fiyatlarda bir sert yükseliş hareketi beklenir.
Sirforex
Kesişimler
Yatay çizgilerin birbirini kesmesi, kesişim yönüne göre bize bir sinyal verir.
Yukarı yön artış sinyali anlamına gelirken; aşağı yönde kesişim düşüş beklentisi anlamına gelir.
leavittbrothers
Uyuşmazlık
Uyuşmazlıklar bir çok göstergede karşımıza çıkar. Uyuşmazlıkların farkına vararak pozisyon almak bize ciddi kazançlar ve zarar engelleme imkanı sunar.
- Fiyat yükselen dipler oluştururken , Stochastic'te alçalan diplerin görülmesi, Olumlu Kesişim(Bullish Divergence) anlamına gelir. Artış beklenir.
- Tam aksine, fiyat alçalan tepeler oluştururken, Stochastic yükselen tepeler oluşuyor ise bu durum Olumuz Kesişim(Bearish Divergence) anlamına gelir. Düşüş beklenir.
 Sirforex
Sonuç Olarak
Stochastic öngü göstergesi, diğer bir çok gösterge gibi bizlere sinyaller verir. Ancak, gösterge sadece grafik üzerindeki hareketleri baz aldığından dolayı, başarı seviyesi düşük kalabilir. Bu yüzden, sadece bir göstergeye bağlı kalmak yerine, diğer göstergelerden de yararlanmak alım-satım işlemlerimizde bizim için daha sağlıklı sonuçlar verebilir.