Fibonacci Trading
We will analyze Fibonacci Extension and Retracement levels.
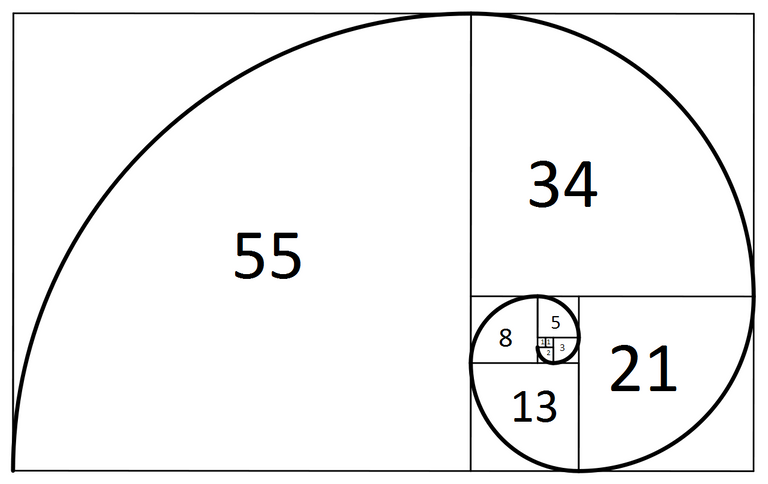
Fibonacci Retracement Levels 0.236, 0.382, 0.500, 0.618, 0.764
Fibonacci Extension Levels 0, 0.382, 0.618, 1.000, 1.382, 1.618
 Seyferseed
Fibonacci tools work best if the market is trending.
- Traders use the retracement levels as potential support and resistance areas.
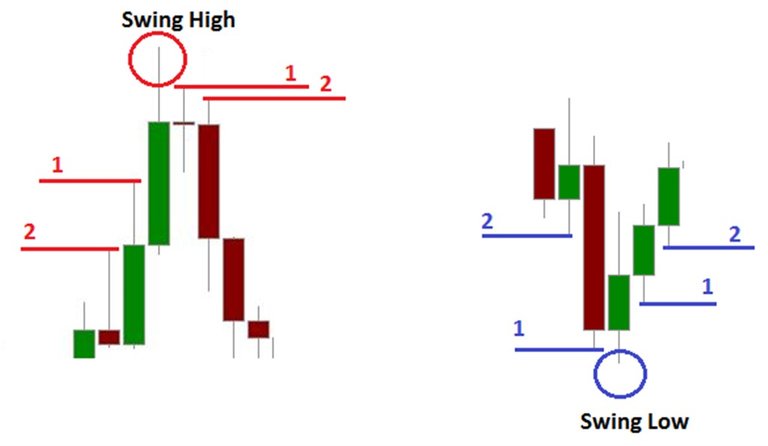
- To apply Fibonacci levels to trading charts, you should know Swing High and Swing Low points.
A Swing High is a candlestick with at least two lower highs on both the left and the right of itself.
A Swing Low is a candlestick with at least two higher lows on both left and the right of itself.
 Forexabode
The Idea is:
- To go long on a retracement at a Fibonacci support level when the market is trending up
- To go short on a retracement at a Fibonacci resistance level when the market is trending down.

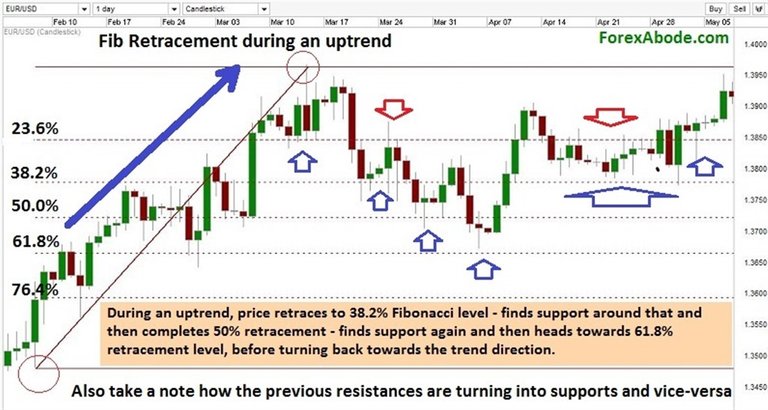
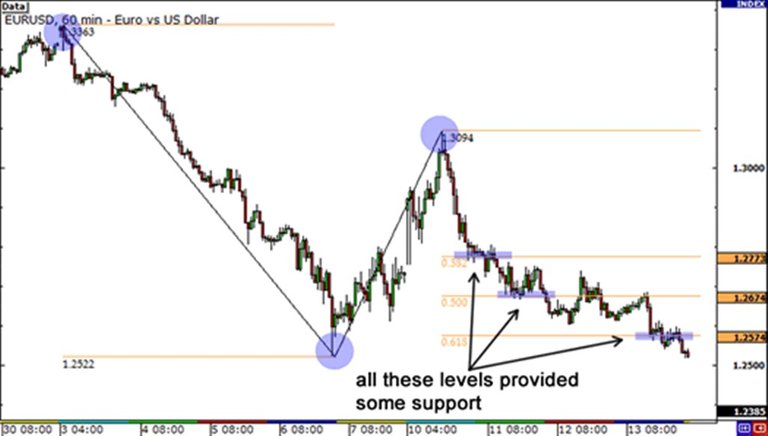
Fibonacci Retracement Levels
A Fibonacci retracement is a term used in technical analysis that refers to areas of support (price stops going lower) or resistance (price stops going higher). Fibonacci retracement levels use horizontal lines to indicate areas of support or resistance at the key Fibonacci levels before the trend continues in the original direction. These levels are created by drawing a trendline between the high and low and then dividing the vertical distance by the key Fibonacci ratios of 23.6%, 38.2%, 50%, 61.8% and 100%. Investopedia
Firstly, we have to find the recent Swing Highs and Swing Lows.
Then, for downtrends, click on the Swing High and drag the cursor to the most recent Swing Low.
For uptrends, click on the Swing Low and drag the cursor to the most recent Swing High.
 Forexabode
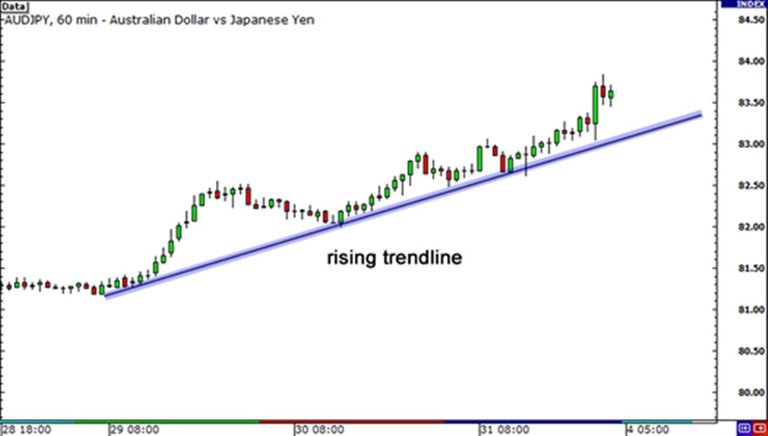
Fibonacci Retracement with Trend Lines
Fibonacci retracement levels work best when the market is trending.
The retracement levels can be used to help you find potential entry points.
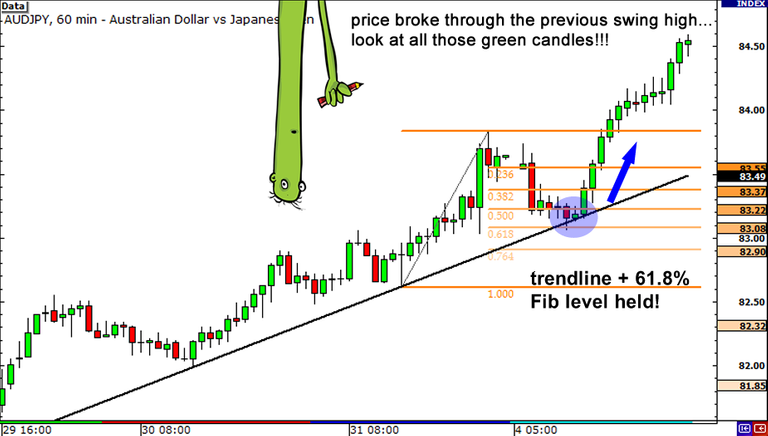 Babypips
Fibonacci Extensions
We use Fibonacci Extension to find targets.
General idea is to take profits on a long trade at a Fibonacci Extension level.
First, click on a significant Swing Low, then drag the cursor and click on the most recent Swing High.
Finally, drag the cursor back down and click on any of the retracement levels.
 Babypips
Crypto-Education Series Episode 1
Crypto-Education Series Episode 2
Crypto-Education Series Episode 3
Crypto-Education Series Episode 4
TURKISH
Fibonacci Seviyeleri İle Alım-Satım
Fibonacci Retracement Levels 0.236, 0.382, 0.500, 0.618, 0.764
Fibonacci Extension Levels 0, 0.382, 0.618, 1.000, 1.382, 1.618
Seyferseed
Fibonacci'nin Uzatma ve Düzeltme seviyelerinde ticari işlem yapmayı baz alacağız.
Bir çok tacir, düzeltme seviyelerini potansiyel destek ve direnç seviyesi olarak kullanır.
Aynı zamanda, uzatma seviyelerini de elde edilen kazancın alınması olarak kullanır.
Grafiklere uygulayabilmek adına, yüksek salınım ve düşük salınım noktalarının bilinmesi gerekir. (Swing High / Low)
Forexabode
Yüksek salınım mum çubuğu, sağında ve solunda en az 2 tane alçalan tepeler olan mum çubuğudur.
Düşük salınım mum çubuğu ise sağında ve solunda en az 2 tane yükselen diplere sahip mumların arasında yer alır.
- Önemli Not: Fibonacci seviyeleri bir trend içinde olan marketlerde en iyi performansı gösterir.
- Temel Düşünce: Fibonacci destek bölgesinden alım yapılması ( going long) ; Fibonacci direnç bölgesinden satım gerçekleştirilmesidir. (going short)
Fibonacci Düzeltme Seviyesi Bulma
İlk olarak Yüksek ve Düşük Salınım noktaları belirlenir.
Ardından, düşüş trendindeki bir markette, yüksek salınım noktasından tıklayarak, en yakın tarihli düşük salınım noktasına ibre sürülür ve bırakılır.
Yükseliş trendindeki bir markette ise, düşük salınım noktasından tıklayarak, en yakın tarihli yüksek salınım noktasınıa ibre sürülür ve bırakılır.
Forexabode
Trend Çizgileri ile Fibonacci Düzeltme Seviyeleri Kullanımı
Bir önceki bölümde trend çizgilerinden bahsetmiştik. Bu bölümde Fibonacci ile uyum içerinde kullanılabileceğini örnekler ile de görelim.
Potansiyel giriş emri verme noktalarını belirlemek adına yararlı iki kaynağı birleştireceğiz.
Babypips
Fibonacci Uzatma Seviyeleri
Genel olarak Uzatma seviyelerini kazancı almak için uygun noktaları saptamak adına kullanırız.
Kullanımı şu şekildedir:
İlk olarak önemli bir düşük salınım noktasına tıklanır, ardından en yakın tarihli yüksek salınım noktasına ibre taşınır ve bırakılır. Son olarak da, Fibonacci düzeltme seviyelerinden hangi seviyeyi isterseniz o noktaya tıklayarak tamamlarsınız.
Babypips