
Like all passwords, ripple is also falling.
But when I saw the ripple chart, I found the same pattern as last year.
Of course, the price of the future does not go exactly the same as the pattern of the past.
However, I did compare the charts with the idea that they would not flow completely differently.
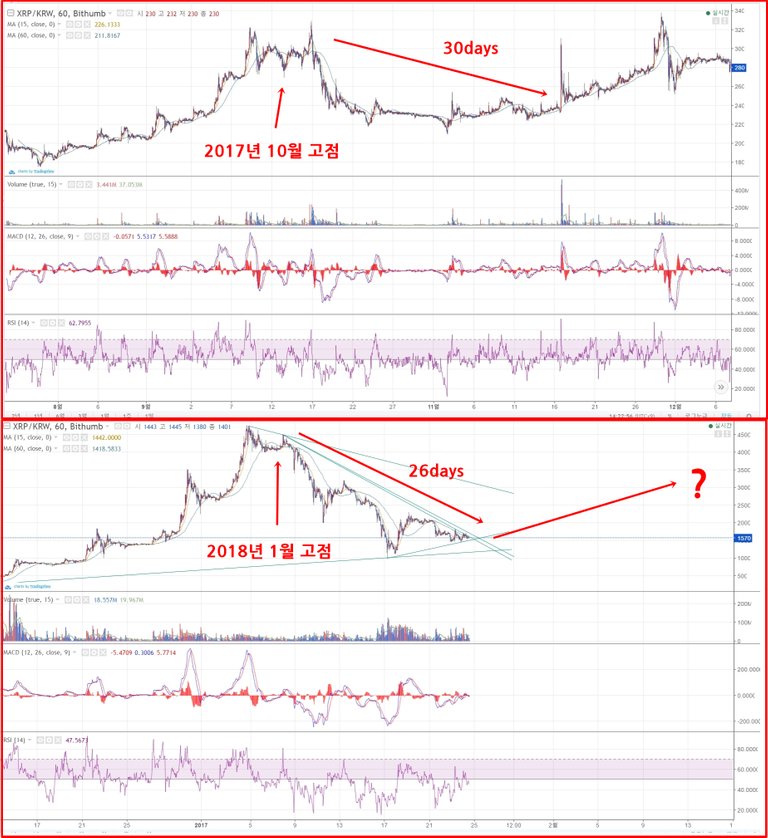
The chart above is at the time of the surge in October 2017.
And below is the situation when it surge in January, 2018.
In the above chart, you can see the similarity between when you jump and when you fall.
If so, we can think about when the ripple will rise again.
At least how long will it take to wait for an upward trend?
After peaking in October 2017, it took about 30 days to move back up.
And until today, the ripple trend has been on the 26th.
Therefore, the price of ripple in February will be a little hopeful.
Of course, there is no guarantee that it will rebound again after 30 days.
However, we know that all of the cipher money in the past has been fluctuating since the sharp decline, and eventually rose again.
How does this trend work this time?
Wait a little longer, or wait a little less.
Time is a problem, and the fact that it will rise will not change.
Has Ripple cracked the deal with Visa hoping for it to go up in Feb
Ripple has more good news as well as Visa.