Candlestick charts are one of the oldest technique used by the Japanese to analyze the trends and predict the market. Unlike the Western way of analysis, where bar chart line is used, I won’t say that candlestick is superior but it is definitely more dynamic and presents more information of the market. Candlestick charts are unused and also unknown to the western market but this technique has evolved from multiple successful implications. In this article, I will try to explain some of the basic ways to read candlestick chart and how to analyze the market.
Filled and Empty graphs: The thick middle part is called body. It denotes the opening and closing of the market. If the body is filled (black), it means the closing price is lower than the opening price. If the body is empty (white), it means the closing price is higher than the opening price.
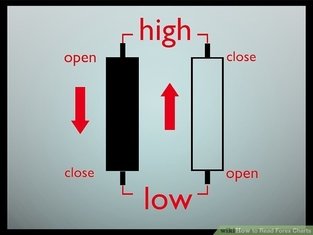
Shadows: The thin line above and below the body are called shadows. They are the upper (upper shadow) and lower (lower shadow) extremes of the session.
Open, High, Low, Close: The market can be bearish or bullish depending on the candlestick. Bearish (a downward trend) market where market opened near its high and closed near its low. Bullish (an upward trend) market where market opened near the low and closed near the high. So, the open, high, low and close is required to draw daily candlestick chart.
Doji: A Doji occurs when the opening and close for the session are same or very close to being the same. If a Doji appears after a long uptrend, then it is a signal that trend has peaked or closing to peak. The same rule applies to downward trend.

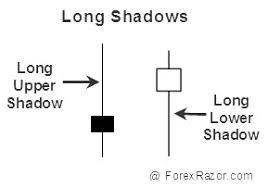
5 . Hammer and Hanging Man: Candlesticks with long lower shadows and short bodies are regarded as hammer or hanging man. It should have no or very short upper shadow and the lower shadow should be twice the height of the real body. If either of these lines emerge in downtrend, it is signal that downtrend should end, and in such scenario, it is called a hammer.
If either of these lines emerge in upward trend, it is signal that the bullish trend should end, and in such scenario, it is called a hanging man. It’s amazing how the same candlestick line can be both bearish or bullish.
I hope this article will be helpful to those who are trying to learn more about how candlestick chart works and how technical analysis can be done based on these charts. This is a elementary article about the candlestick charts, I will be writing more about the REVERSAL PATTERNS, CONTINUATION PATTERNS, STARS and DOJI in my next piece.
Congratulations @bibekubrick! You received a personal award!
Click here to view your Board of Honor
Congratulations @bibekubrick! You received a personal award!
You can view your badges on your Steem Board and compare to others on the Steem Ranking
Vote for @Steemitboard as a witness to get one more award and increased upvotes!