If you're still a beginner in cryptocurrency trading, I recommend first reading cryptocurrency trading (part 1) . This article builds on the knowledge shared therein.
In part 1, you will find out how important it is to understand the market and the associated (mass) psychology. In addition, I can not stress enough that controlling your own emotions is essential to becoming successful in cryptocurrency trading . This article will go deeper into the technical analysis of trading and how you can benefit from other traders.
Support and Resistance
The most important and easy-to-understand concepts within cryptocurrency trading are support and resistance. As the name suggests, support means that the cryptocurrency at a certain price supports many buyers and resistance means that a cryptocurrency at a given price is quite resistant to sellers. In fact, it is a support / resistance level where the price does not seem to break through.
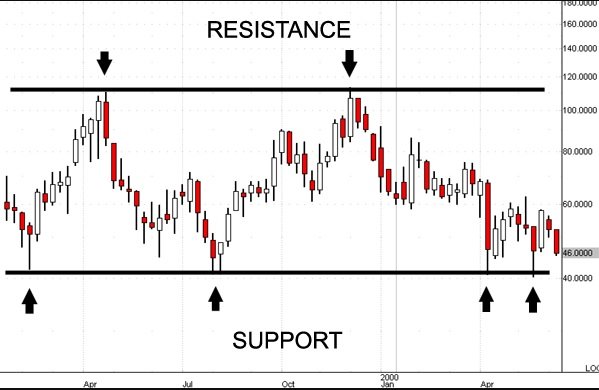
A price level can first serve as a resistance (a price ceiling) and once broke it can serve as a support (a price base) or vice versa. It is important for a trader to distinguish and recognize it.
Candlesticks
Candlesticks are essential to be successful. A candlestick is a kind of mini graph that shows the highest rate, lowest rate, opening rate (open), and closing price of a cryptocurrency within a given period. These are used to predict which direction will be the cryptocurrency rate (most likely). The period during which the candle shows this may vary from 10 seconds to many years. Having mastered the reading of candlesticks will make it a lot easier to decide when you need to buy or sell a cryptocurrency.
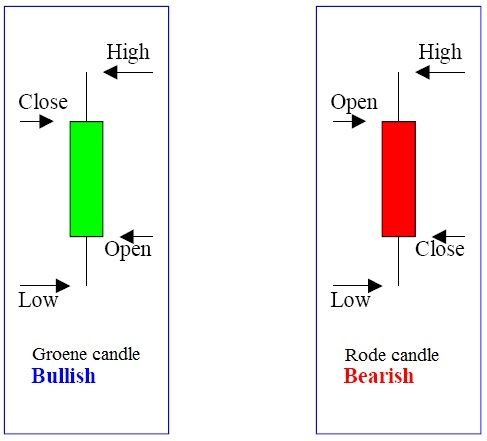
You have green and red candlesticks. A green candlestick means that the price has risen, while a red means that the price has fallen. At a rising rate (and thus a green candlestick), the top of the high (highest rate within that period) is displayed, including the close (the price of the cryptocurrency at the end of the period). Below are the open (the price of the cryptocurrency at the beginning of the period) with below the low (lowest rate within that period). With a red candlestick, the 'open' and the 'close' are logically the other way around (falling rate means closing the price lower than it opens). The 'stole' from the top of the candlestick to the bottom of the screen shows the price range of the relevant period.
- High: The highest value of the cryptocurrency within the period
- Low: The lowest value of the cryptocurrency within the period
- Close: The value of the cryptocurrency at the end of the period
- Open: The value of the cryptocurrency at the beginning of the period
What information can you get from this?
The information you can get from candlesticks is mainly chart patterns or chart patterns. Candlesticks can give signals whether a trend keeps on the same direction or not. It is therefore possible to distinguish between three patterns:
- Continuation: The trend continues in the same way
- Decisionlessness: It is not clear which side the trend is. Buyers and sellers both seem to be in a hurry
- Reversal: The trend is running. The price is decreasing ascending or ascending to descending
The 4 most important candlestick patterns
There are very many candlestick patterns that can indicate what's going to happen with the course, but there's a whole article about it that can be written on its own. For now it is especially important that you recognize the 4 most common and powerful patterns.
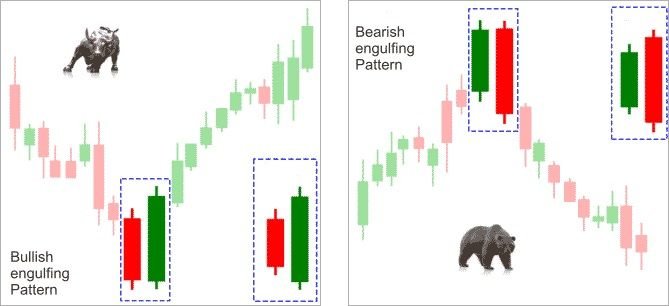
Bullish Engulfing Candlestick
A bullish engulfing candlestick is formed when the price of a cryptocurrency within a certain time period has been both higher than the highest price of the previous period as lower than the lowest price. It bridges (engulfs) both prices. This pattern, as it were, shows that the price of the cryptocurrency has gone down, but here has found support, making it a bullish upward movement to break the high of the previous period. This candlestick is often the sign for an upward trend.
Bearish Engulfing Candlestick
The bearish engulfing candlestick is logically the opposite of the bullish engulfing candlestick. In this case, it also bridges both the high and the low of the previous period, but is close to the open. This candlestick can appear at the top or inside a trend, which signals a trend that will go further down.
Hammer Reversal Candlestick
This candlestick occurs mainly at the bottom of a downward trend or at the top of an upward trend. This name has the candlestick due to its shape; It's very much away from a hammer. When you encounter the hammer reversal candlestick, that can be a sign that the trend is about to turn. The longer the "stem" of the hammer, the more this indicates that the market has tested the support or resistance. After they have been tested 'low' or 'high', bulls (traders who think the market is rising) or bears (traders who think the market is falling) takes over the market and can expect a reverse trend.
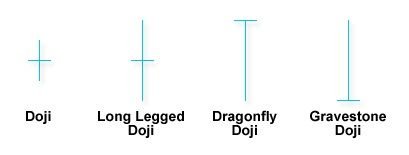
Doji Candlestick
A Doji candle shows indecision on the market. It is not clear whether the market will go further up or down. These candles are in the form of a cross. At this point, bulls and bears are challenging which side the market will go on. The Doji candlestick therefore has a small body (with the open and close close together) and a slightly longer 'stem'. With Doji candles, it's usually not a good idea to trade because the market can rise and fall from that moment on. However, it gives a clear signal that the sentiment of the market can change.
There are many other candlesticks that can deliver a signal, but with these 4 you are already on the way. In addition, candlesticks provide a very small amount of information and can best be used with other indicators such as volume and chart patterns.
Volume
Volume reflects the degree of financial and emotional involvement among traders. The decision to buy or sell a cryptocurrency may seem a rational decision, but buying causes (many) traders to become emotionally involved. Both buyers and sellers strive to make the right trade. Therefore, you can also see the size of the volume on the market as the total emotional involvement among traders.
In addition, it is important to mention that volume is a relative understanding. A certain amount of volume may be very high for NEO , while Bitcoin is very low. You should always compare the volume to the volume of the same cryptocurrency at a different time.
You can use volume to estimate how strong or weak a particular motion or signal is on the market. If the price of a cryptocurrency goes up, but the volume stays the same or goes down, then this shows a lack of interest in the market. This may be a warning for reversing this trend. Or, for example, if prices drop and volume rises significantly, this is a clear signal that prices will fall even further. The high volume indicates that the (in this case downward) trend has a lot of support from the market and so the trend will not change. In fact, you have 4 situations:
- Upward trend, lots of volume: The trend is likely to continue in the same way and the price will continue to rise
- Upward trend low volume: There is little market support for this trend and there is a great chance that this trend will reverse and price will rise
- Downward trend, a lot of volume: The trend is likely to continue in the same way and prices will continue to decline
- Downward trend, low volume: little about this situation can be said because a downward trend is often associated with less volume. At Wallstreet they have nothing for the word saying: "It takes buying to put prices up, but they can fall of their own weight."
Chart patterns
Chart patterns, ie chart patterns, are the most important for a trader to be able to recognize. You need to train your brains and eyes properly to spot these patterns. You should not see chart patterns as a way to predict whether the price goes up or down. You can see this better as an area of consolidation (period of indecision), where a breakout from this area can lead to a great new trend in the same direction. Make sure that the price action always determines what you are going to do, and do not try to predict where to go in advance. Predicting is what losing traders do, following the trading rules is what professional traders do.
Below is a pic with the most common chart patterns (you can view the image by opening it in another tab). See if you recognize the candlesticks mentioned above.
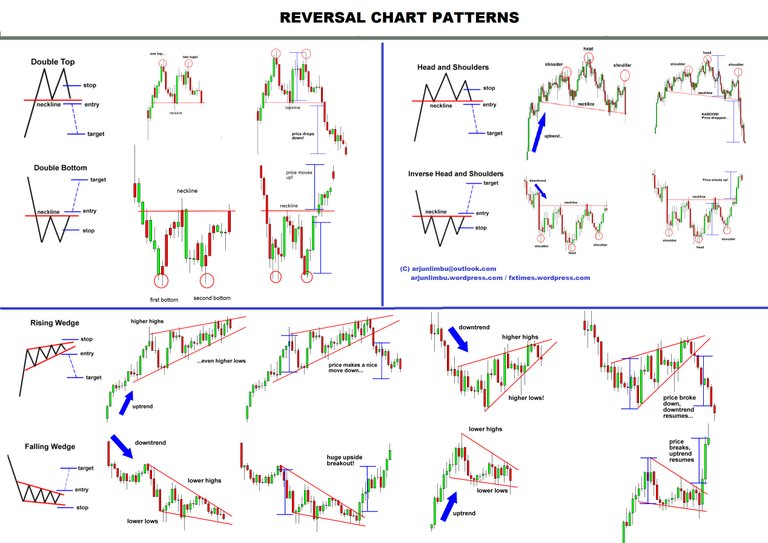
So try to train your eyes and brain to recognize and behave these patterns as shown in the picture:
- Entry: This is the time of the breakout and so the moment you can best buy the cryptocurrency (at a breakout up) or sell (at a breakout down)
- Stop: The moment you have to enter your trading position. A chart pattern does not give a 100% guarantee that the price will actually be on the side of the breakout. In the event that this does not happen, you have to pay a price with yourself, taking your loss before this loss becomes larger. On some online exchanges you can set these stops yourself
- Target: The point at which you get your win. Make sure that you always agree with yourself in advance. With cryptocurrency it is often difficult to estimate because the cryptocurrency may increase 500% in a week's time. Of course, you do not want to miss this boat, so it's sometimes the most profitable to use 1 tactics during a bull period: HODLL
And now?
After reading both of these articles about cryptocurrency trading, you have at least 90% of the people who buy and sell cryptocurrency. However, this does not mean that you can already be profitable. To do this you have to practice and there are a lot of other technical skills and a lot of discipline. This is a good base for practicing!.
Sources:
Link #1
Link #2
Link #3
Link #4
Thanks for reading, I hope you liked it!

Steem's Popularity Is Incredible!
Share the joy by inviting others!
Get More Exposure On The Chats!
It is a best way to get more exposure through private messages and in the chat rooms. These are some of the best places to get more exposure & makes Steem friends.
- Official Steemit.chat
- SteemSpeak.com @fyrstikken (24/7 Voice chat)
- Peace, Abundance, Liberty @aggroed @canadian-coconut @ausbitbank @teamsteem and More (Minnow Support Project)
For new & best authors to move forward!
http://curiesteem.com @curie
https://steemvoter.com @steemvoter @thecryptodrive @cryptomancer
My Latest Posts:
- Cryptocurrency trading (Part 1) - Everything you need to know about crypto trading!
- Game Review: Yo-Kai Watch 2 Psychic Specters Review
- Minecraft Story Mode Season Two Epsiode 3 Review - Jailhouse Block
- Tricopigmentation against hair loss and baldness in men
- Pregorexia - Pregnant women who find themselves too fat
- Pillars of Eternity Complete Edition Review - Performs the impossible
- The astrologer - Famous people can afford the eccentricity that would immediately suspect ordinary people.
- Nintendo Classic Mini SNES Review - A classic in a new jacket
- In the bus....Something nice on the early morning you do not come up everyday
- Game Review: Rayman Legends Definitive Edition - Complete to the Switch
- Insane over the centuries: admired and feared
- Mouthflora: Good and bad bacteria in your mouth...

Very good article I picked up quite a bit of new information about charts and investing in cripto I’m still new so I have a lot to learn I will check out your other posts as well thank you for the info
Nice one brain! Looking forward for more learning and tips so i follow, upvote and resteem you :)
@eileenbeach has voted on behalf of @minnowpond. If you would like to recieve upvotes from minnowpond on all your posts, simply FOLLOW @minnowpond. To be Resteemed to 4k+ followers and upvoted heavier send 0.25SBD to @minnowpond with your posts url as the memo
Good article. Thanks for sharing!
Thank you very much for this summary! I learned a lot and hopefully this will pay out for me in the future. Will there be a part 3? I hope so, please continue with this series and tell us your wisdoms!
This post really deserves more upvotes, keep on anyway, payout is not everything ;)
Greetings @ddot
Very informational article. Thanks for sharing
This post received a 3.64% upvote from @randowhale thanks to @braini! To learn more, check out @randowhale 101 - Everything You Need to Know!