
There's something slightly unnerving about seeing your portfolio bounce back up dramatically after events such as we've seen the last two days, but I'll take it any day!
Are we over the worst of it? Personally I'm not holding my breath, but it was great to pick up so many discounts over the last few days!
- Enjoy the green days whilst they last!
- Remember what we've witnessed the last two days. You'll be that little bit more ahead of the game the next time hopefully
- Don't dive in too quickly and buy everything you see on the up as it could come back down just as fast!
What I'm looking at right now:
EDIT: forgot to add in Bitcoin.....
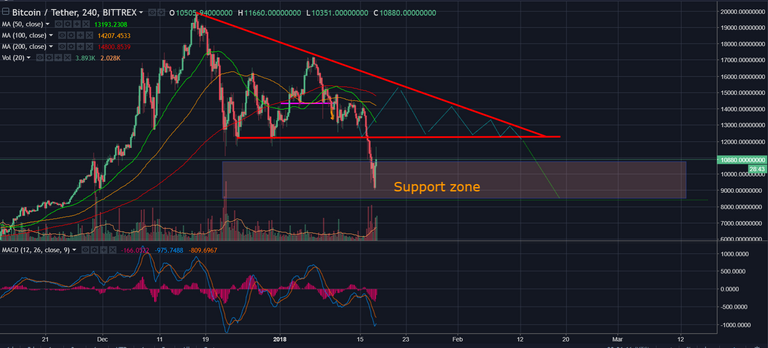
Bitcoin (BTC/USDT) 4 hourly chart is below showing that we have gone firmly into the support zone, but much earlier than expected. Although the pattern I marked up a few days ago has been broken early by the flash crash, I still have a feeling it will follow a similar trend over time, but may just dip in and out of the support zone for a few weeks. I don't think we are over the worst of it yet, but I do think we could see some dramatic upsurge when BTC finally gets institutional investments returning
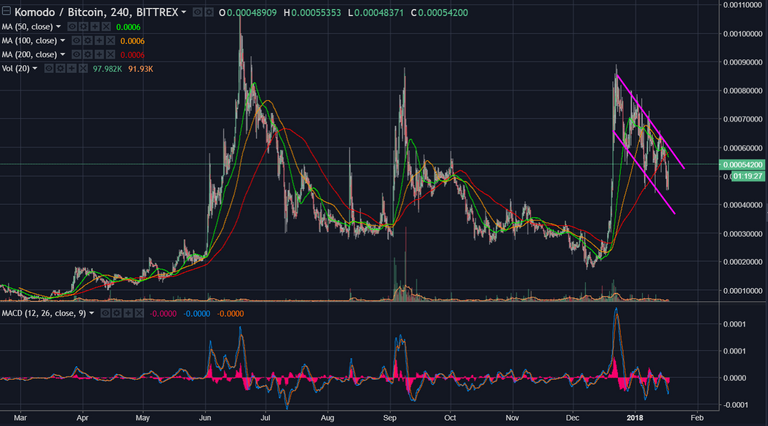
Komodo (KMD) - 4 hourly chart showing potential bull flag (drawn out and disrupted by the crash though so I'm not 100% convinced) - watch with caution!
Ark (ARK) - 4 hourly chart showing a break in the numbered fractals highlighted due to the crash, but I'm still a believer! (note the MACD looks very healthy in relation to the pattern we're looking for!)

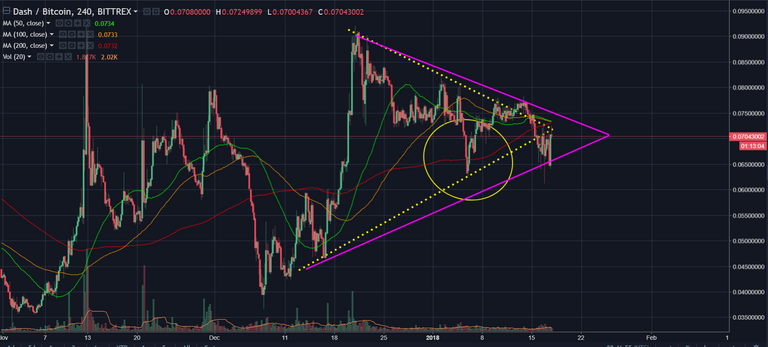
Dash (Dash) - 4 hourly chart showing my adjustment from the original symmetrical triangle in yellow broken lines to a new purple triangle which I'm happy to say works for me. Again, the crash seems to have pushed things out a little, but if all continues to return to the previous bull trends we were seeing, I'll still be looking for my new all-time-highs (ATHs) from Dash)
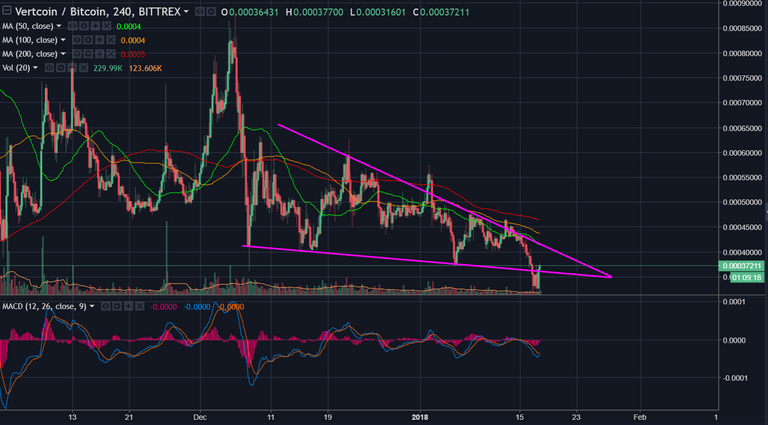
Vertcoin (VTC) - 4 hourly chart has presented what looks like a very bullish falling wedge pattern. MACD is also looking healthy for VTC to potentially do another of it's mental price surges then complete dump. It has been holding it's gains reasonably well during recent surges so I'm liking VTC right now. The crash led it to break through the support line of the wedge, but we won't hold that against it as didn't every crypto break down through everything the last few days!?!
This is post only contains my personal views and opinions and is not financial advice. You should always do your own research and only invest what you can lose to afford.
Register at KuCoin.com here to start trading, earning bonuses and collecting compound interest on KuCoin Shares (KCS)
Signup here to use the free Bitcoin faucet or here to collect free Dogecoin
Visit CryptocurrencyPro.io for news and information on trading and portfolio management


Interesting and serious analysis as always, keep on giving us that type of advice ! I enjoy the down periods of the market as entry points to buy too.
Thanks for the kind words @loonyfool!
good post :) and interesting perspective, buy low, sell high
Thanks @paulspujats ! Hopefully we get some of the patterns from this post turning into reality in the coming days or weeks! Isn't too bad watching the downturn if your portfolio lows are equal to your previous highs! :)
Resteemed by @resteembot! Good Luck!
Curious?
The @resteembot's introduction post
Get more from @resteembot with the #resteembotsentme initiative
Check out the great posts I already resteemed.
This post was resteemed by @steemvote and received a 44.36% Upvote
This post has received a 0.63 % upvote from @drotto thanks to: @vallurivikram.
Your post has been Resteemed @cryptomagic
Send 0.03 Steem or SBD and your link as memo to get resteem. I have 1100+ Active Followers.