Conclusion for today’s Zcash price prediction: A bullish swing is expected to target between 0.010803 and 0.010560.
The 1 hour timeframe of Zencash (ZEN/BTC) is provided in this analysis with major consideration for the current chart patterns and their possible implications. Previous downtrend is highlighted using the bearish trendline that was successfully broken to the upside on June 27, 2019.
Instagram: https://www.instagram.com/coin_analyst/
Twitter: https://twitter.com/Cryptotrader029
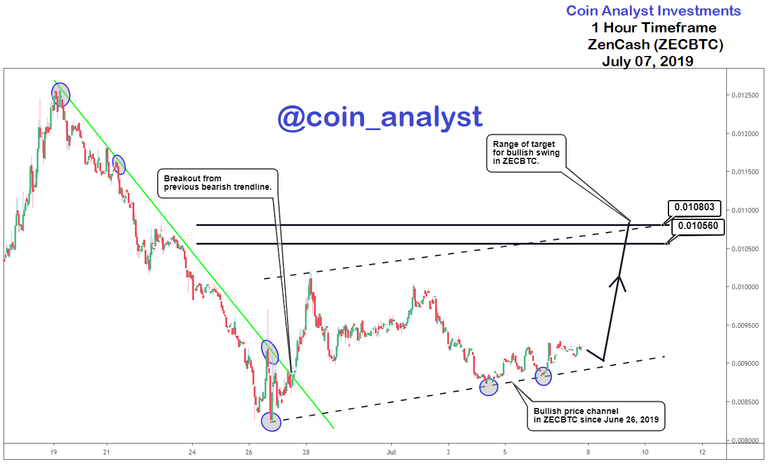
ZECBTC has remained in a sideways trend ever since breaking its bearish trendline with a bullish channel (tentative) identified to provide context for price action. The trajectory expected is indicated on the chart and the region of target for the Zencash price prediction is between 0.010803 and 0.010560.
Patience is also required to see what transpires in terms of entering long (buy) position(s).
A close above ~0.009294 can be used as part of the strategy to buy ZECBTC.
Alternatively, a successful retest of the lower boundary of the bullish channel at ~0.008936 provides ground for bullish momentum.
A close below the channel’s lower boundary and also below ~0.008671 implies further downside action in ZECBTC.
Our previous Bitcoin analysis (BTCUSD) before the current price rally was also posted for FREE and can be found here.
https://coinanalyst.investments/2019/04/26/btc-analysis/