I talked about three signs that help to decide on the purchase of a cryptocurrency. Now you will learn about three signs that will prompt you whether it's time to sell the coin. We will use the Coinigy platform, which I talked about. We go in and select a pair of BTC / USD on the BITF.
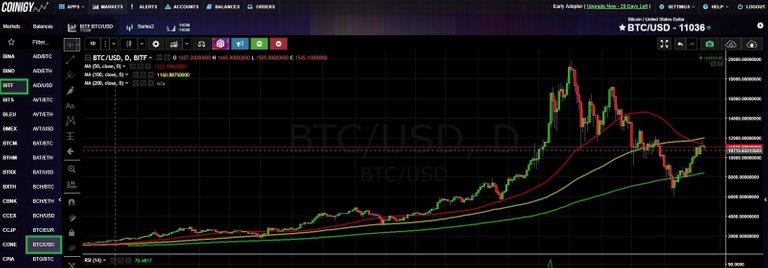
Next, using the "Indicators" button, we create four auxiliary graphs. The first one is "RSI" (I made it green below). The other three are "Moving Average" with parameters from yesterday's guide (Input - Lenght - 50, 100, 200). Everything is ready for analysis.
Is the strategy implemented?
The first sign is the achievement of the goal. Before buying, you should have a clear strategy, which you will adhere to. Imagine that you wanted to double your money and bought bitcoin. When you have achieved the desired goal, you can fix the profit. If it works, we move to the second sign. If not, stick to our strategy.
Average price for a period of time
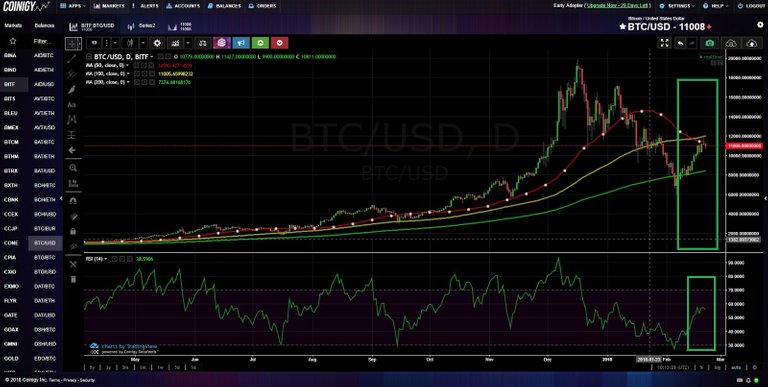
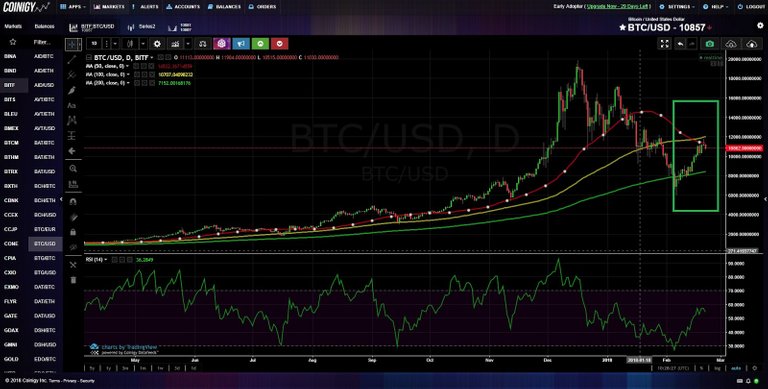
The second sign is the graph of the cryptocurrency is above the "Moving Average" charts. When it is lower, we buy a cheap currency and make a profit. When the graph is higher, it's time to think about selling.
Relative Strength Index
The third sign is that the value of the "RSI" chart exceeded "75". This chart is an indicator of the "health" and "well-being" of the currency. If the value is higher than "70", then all around buy up the currency. And when they buy it - we sell. In order to avoid risks and to get a good profit, we'll start selling when the value of "RSI" exceeds the "75".
Sort: Trending