
The price of Bitcoin Cash has decreased by 9% from yesterday’s open at 773,4$ which was also the highest the price has been to 701$ at the lowest point today.
The price has recovered slightly since the low as it’s currently trading at 714,3$ but the spike to 701$ was the first interaction with the key support levels on the baseline support line 2.
Zooming out onto the daily chart we can clearly see the significance:
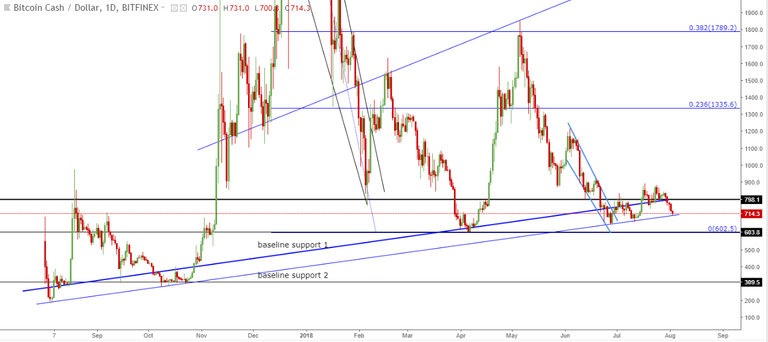
Both baseline support 1 and 2 are dating from the beginning of time for Bitcoin Cash which is actually exactly one year ago when the hard fork happened and BCH hit the market. Baseline support is especially significant as the price always found support there and the level was never broken.
However, today’s interaction would mark the fifth interaction with it which weakens the level, and as you can see this is the third interaction in just a little over a month. This indicated a lot of selling pressure so a breakout on the downside could happen.
Analysis
For further discussion lets first examine the structure and two fractals that can be seen on the daily chart, the similarities, and differences.
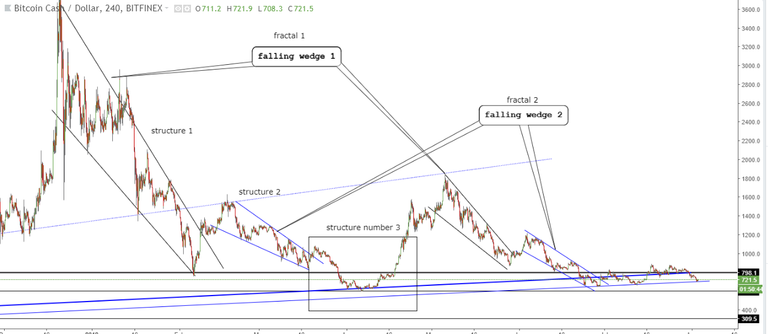
So as you can see there are 3 structures of which the first two are fractals but the third one isn’t. Fractal 1 is a falling wedge pattern from which the price broke out on the upside and went on to form another smaller falling wedge pattern which is the second fractal. From the second structure falling wedge, the price also broke on the upside but failed to keep up the momentum which resulted in the price crashing from 1064$ at the high to 602$ to the baseline support 1. That was a 43% decline in 15 days.
Last structure is totally different: in the first case, it has a U shape bottom after which the price grew exponentially and the current one looks like a range. Zooming into the 2-hour chart we can clearly see the similarities and the difference.
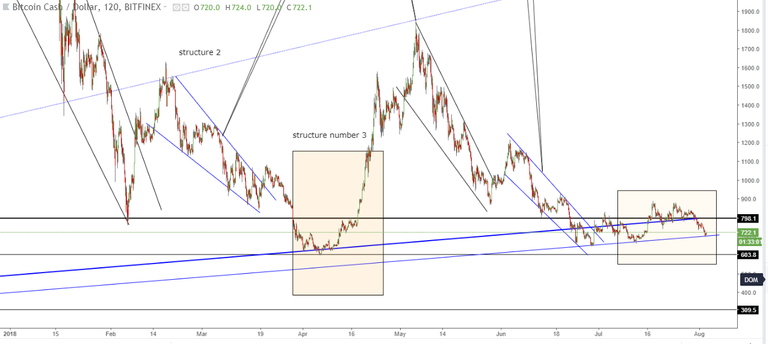
Similarities are that after the initial breakout from the falling wedge on the upside, the price fell lower and create the U shape bottom before an exponential increase, the difference is in the second case that the price didn’t continue to go upward instead it came back slightly higher than the level of the U shape bottom.
Conclusion
What does this mean? Well, this means that bears are in control and that a breakout should be expected but not before some short-term recovery to retests the baseline support 1 which now serves as strong resistance.
Zooming in to an hourly chart and labeling the wave I have projected the target for the B recovery wave to be at around 809$ where the baseline support 1 intersects the 0,618 Fibonacci retracement level. As you can see from the hourly chart a breakout occurred from the minor ascending triangle and most likely we are going see an ABC move as the wave A already developed nicely in a 5 wave motive wave manner.
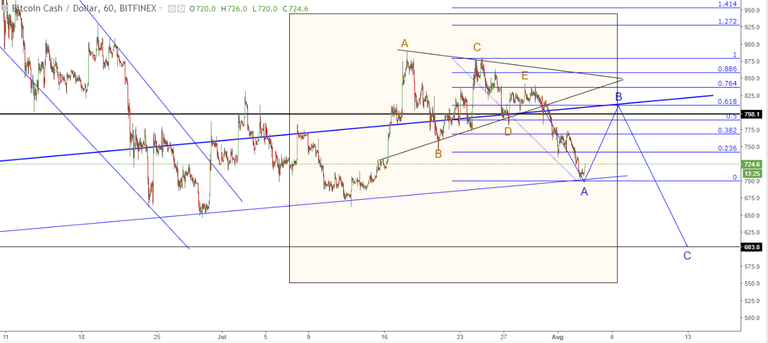
If the B wave develops in a three wave move that will confirm my count and I would be expecting the price to go down to the next horizontal support level that is strong enough to hold the momentum and that would be at 603,8$. That is the prior low level on the daily chart and you can scroll back to the beginning of this post to remind yourself how the daily chart looks like and why this level is considered significant support.
Looking at the BCH/BTC chart we can see that the price has more room for a decrease before a potential breakout from this triangle like it did before.
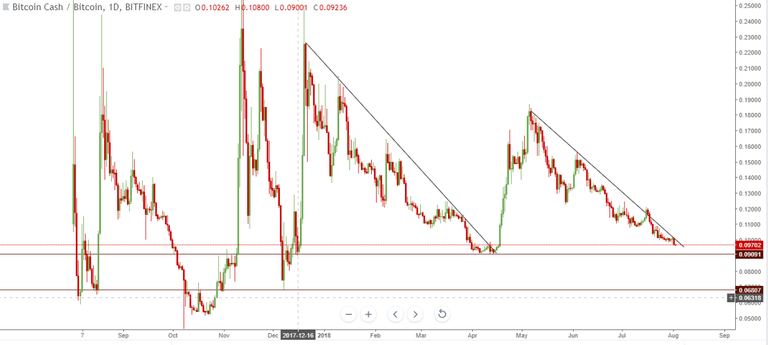
I have measured the percentage distance from the current price to the support at 0.091 level and it’s 6,44%. The BCHUSD chart is measuring 15,71% decrease from the current levels to the target levels, which correlates with the expected decrease of Bitcoins price to 6700$ which is 10,47%.