Summary:
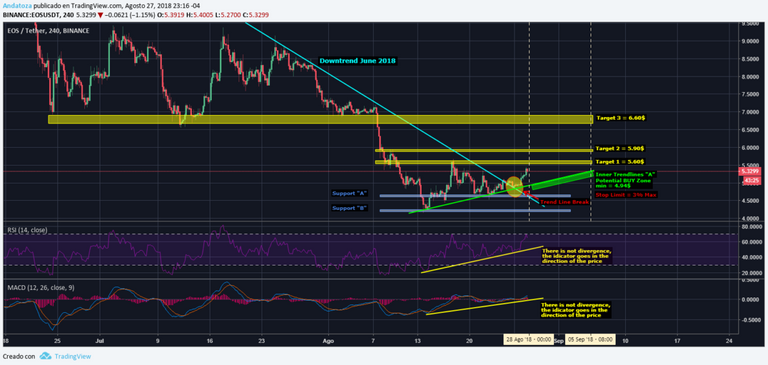
EOS (EOS), Then having a valid break of the Bearish Tendency since June 2018, creates a bullish Inner Trendlines where we can evaluate the following.
Investment:
For the graphic in the frame H4
1st Buy at the touch of the Inner Trendlines “A”, starting at $ 4.94 and tracking according to the projection of the trend
Take Profit 1 = $ 5.60 (10%)
Take Profit 2 = $ 5.90 (18%)
Take Profit 3 = $ 6.60 (30%)
Stop Limit = Calculate at 3% as Maximum from the point of BUY
In the case of losing the Inner Trendlines “A”, I recommend waiting for the price drop back to the supports plus amounts identified in the graph and evaluate BUY at those levels (Support “A” = $ 4.60 and Support “B” = $ 4.20)
IF the price does not fall back and continues its upward path, I recommend waiting for a $ 5.60 resistance break, expect it to become a support to evaluate BUY at those levels.
3.- The MACD and RSI indicators in this framework do not show a divergence and they go in the direction of the price, so I recommend guiding ourselves in this opportunity for the Price Action.