When trying to work out support and resistance areas it is advantageous to use Fibonacci retracements, but what are they? And how do they work?
First off I use tradingview.com for my charting which I believe to be a a very useful app to map out trading. Do comment at the bottom if you need help getting set up.
So on tradingview you can select the thrid option down and then with the menu that opens up click on Fib retracement.
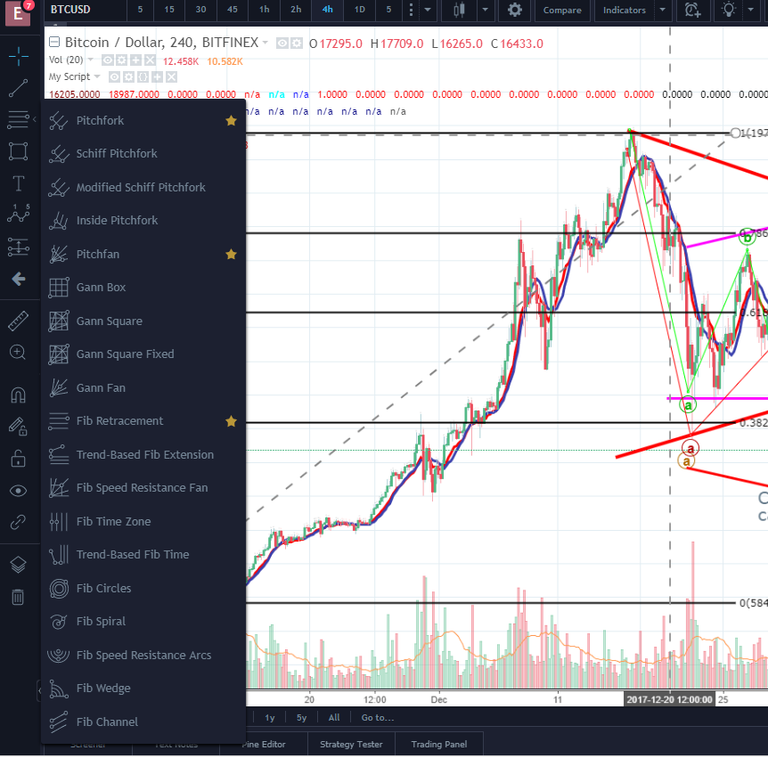
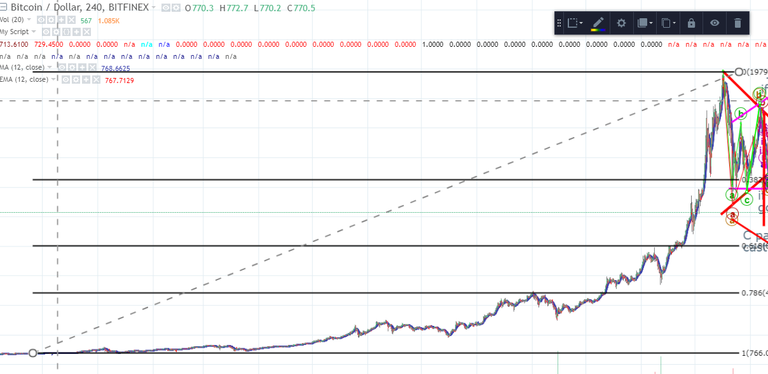
Once you have it open you will need to draw the fib retracement out. The trick to using this is to make sure the chart is zoomed out so that you can take the low of the recent bull run, and draw all the way up to the high of the bull run. As shown below..
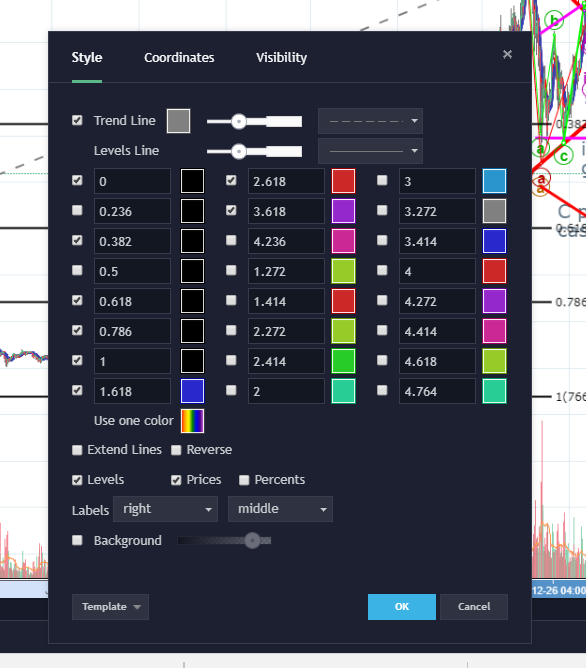
On the chart you will want to ensure that the same numbers are used as the one I have below. Also ensure that the reverse option is not ticked. This will make sure that we are doing a fibinacci retraement... which is what we want if we are wanting to see how the bear market will perform.
Now we can say that its most likely that the correction which is usually an ABC pattern and always comes after the (5 wave impulse ) will end around the 0.618 fib level on our graph.
This was a very rough guideline for fib retracements and if there is anyone interested I would me more than happy to cover extensions and retracements in far more detail along with how to line them up and how the elliot waves and subsequent ABC corrections work.
Please upvote, resteem and subscribe if you like my content.
Have a nice day :)!