To Traders and Investors,
Congratulations for enduring through the year of 2018! We have experienced unexpected turbulence during the last quarter of 2018 in the US equity market (US indexes closed with worst yearly losses since 2008). Despite the optimistic and bullish prediction, the cryptocurrency market experienced a year-long bear market bitcoin losing about of 80% of its value and greater loss incurred on altcoins. As you all know, you must continue to play the game and withstand the market turbulence to enjoy the return on investment.
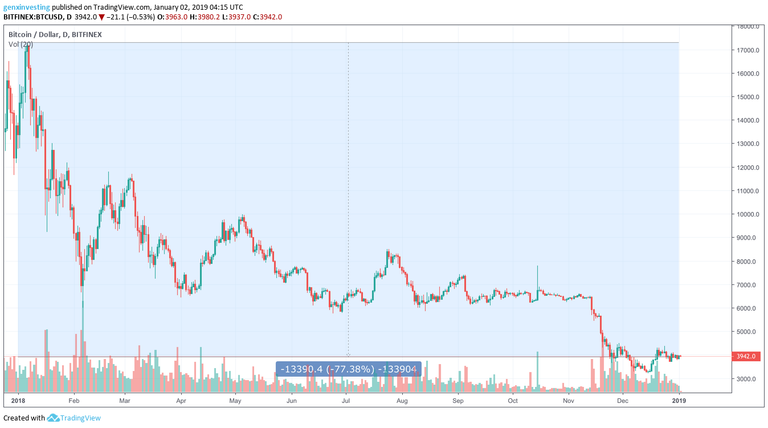
Figure 1: Bitcoin 2018 Chart
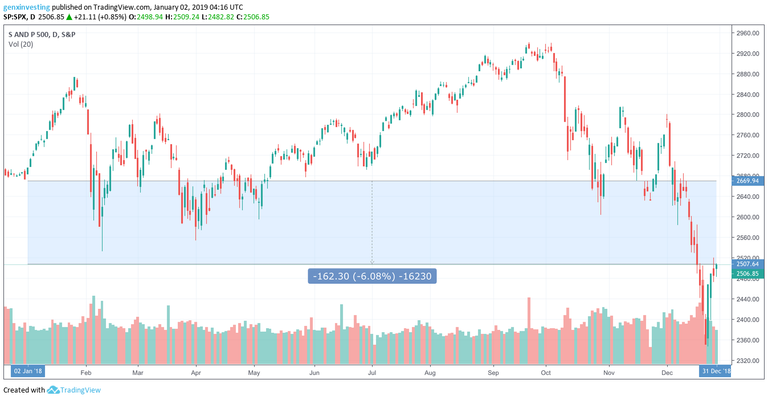
Figure 2: S&P 500 2018 Chart
Many of you might have incurred a significant loss to your portfolio and hard earned capital. Contrarian and value investors are constantly reminding us to buy when there is blood on the street and be greedy when others are fearful. An investor who has gone through the market correction and crisis will tell you that it is much easier said than done. However, Warren Buffet correctly pointed out that times like these are the perfect opportunity for us to invest in ourselves because the more you learn the more you earn. The market just turned on the seat belt sign; it is time is now to fasten your seatbelt and learn how to navigate through the storm.
The US Equity Market Seatbelt Sign
Since the 2008 housing market crisis, the US equity market enjoyed almost a ten-year long bull market. The market was able to auto-pilot through the bull run because of the power fueled by the government stimulus package (quantitative easing, low-interest rate, and tax reform). The government's stimulus package and bailouts did stop the market from going into long-term recession. However, society had to pay the price. The government approach to buying equity to inject necessary liquidity into the market also inflated the price of equity for the wealthy. Ray Dalio correctly pointed out the issue in his recent book Principles for Navigating Debt Crisis. The wealth gap in the US reached the point where the net worth for the top 0.1% of the population is approximately equal to the bottom 90% combined!
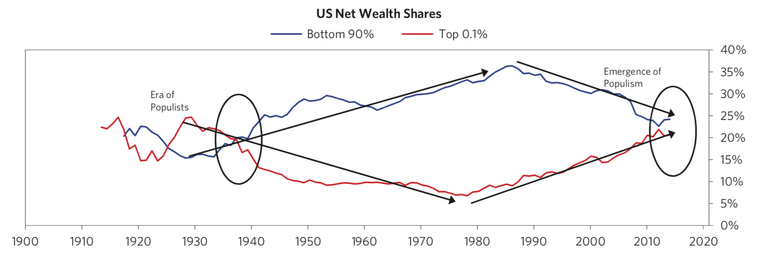
Figure 3: US Net Wealth Shares Chart from Principles for Navigating Debt Crisis by Ray Dalio
This phenomenon is not just occurring in the US. The global market has gone on a spending spree and accumulated over $240 trillion debt.
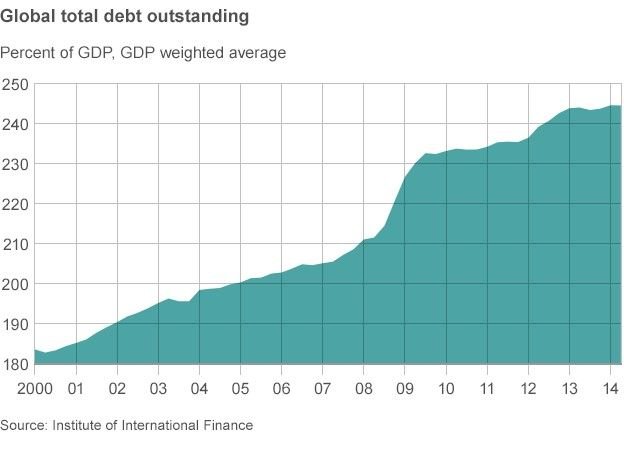
Figure 4: Global Total Debt Outstanding
The global market needs to start the deleveraging process to minimize the severity of the debt crisis. The US Federal Reserve started raising the interest rate since 2017 to cool off the economy and achieve manageable growth. Many investors and economists share the opinion that the bull market is coming to the tail-end, and a bumpy ride is expected based on the following market signals:
- Total Market Cap to US GDP Ratio - This is one of Warren Buffett's favorite market indicator to measure the valuation of the market. The indicator compares the total market index to the United States’ last reported GDP. Based on the historical ratio of total market cap over GDP, the market is significantly overpriced and expecting a negative correction.
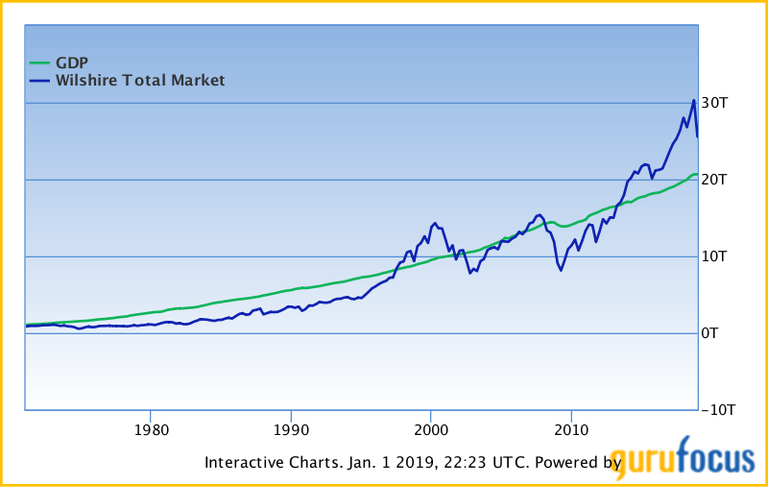
Figure 5: Total Market Cap US GDP
.png)
Figure 6: The Ratio of Total Market Cap to US GDP
- Unemployment Rate - The investors closely follow the unemployment rate which indicates the health of the economy. Since the 2008 crisis, the unemployment rate has decreased significantly and achieved a 49 year low of 3.7 percent. This is great news for US economy. However, the lowest unemployment rate serves as an early indicator of an upcoming recession. The lowest unemployment rate potentially indicates that the max capacity of the economy has been reached and higher probability of a correction.
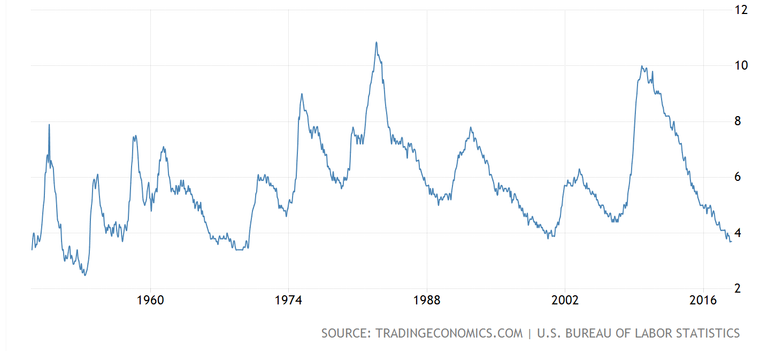
Figure 6: US Unemployment Rate
- Yield Curve - A yield curve measures the bond investor sentiment against the risks and outlook on the future economy. The yield curve is often used as a guide for the direction of the economy. In the normal market situation, short-term bonds carry lower yields because of less risk to investor’s money. The long-term bonds carry higher yields to compensate for the long-term commitment of investor funds.
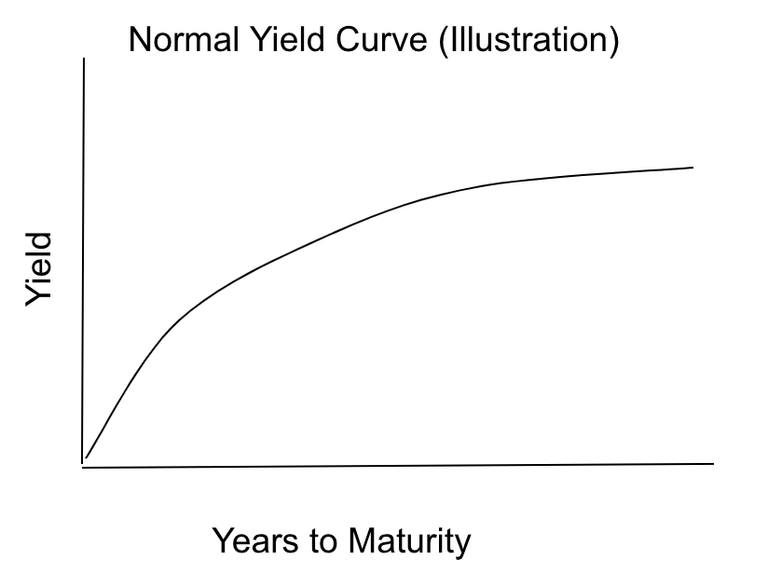
The current yield curve is inverted such that the long-term bond has a lower yield. This seems counter-intuitive, but the inverted yield curve indicates that bond investors show negative sentiment towards the future economy. They are trying to lock in the current rate before they fall lower. The conventional wisdom of the flat or inverted yield curve is a leading indicator for economy stagnate and downturn.
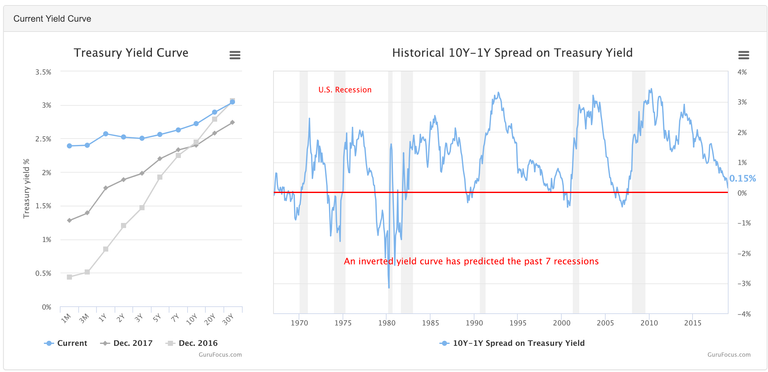
Figure 7: US Treasury Yield Curve
- Correction in Emerging Market - During the global financial downturn, the emerging market usually shows the first sign of weakness. Following the Greece government debt crisis, Turkey experienced a currency and debt crisis in the year 2018. With the current interconnected global economy, we might experience a higher frequency of government crises and subsequent ripple effect. The geopolitical tension in the US and China trade war is not really helping the case.
Figure 8: Emerging Market Index
- Correction in Key Industries: During the financial downturn, certain industries are hit harder than others. This includes the auto, financial, and housing markets. These critical industries experienced a 20-30% correction. The market is showing warning signs, and investors must continue to monitor the signals.
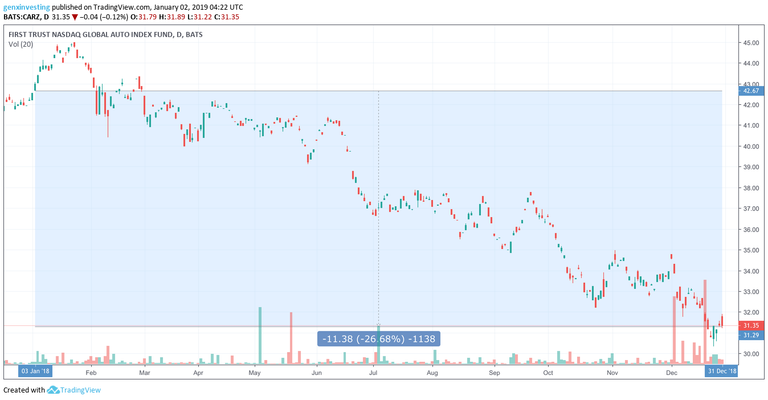
Figure 9: Global Auto Index
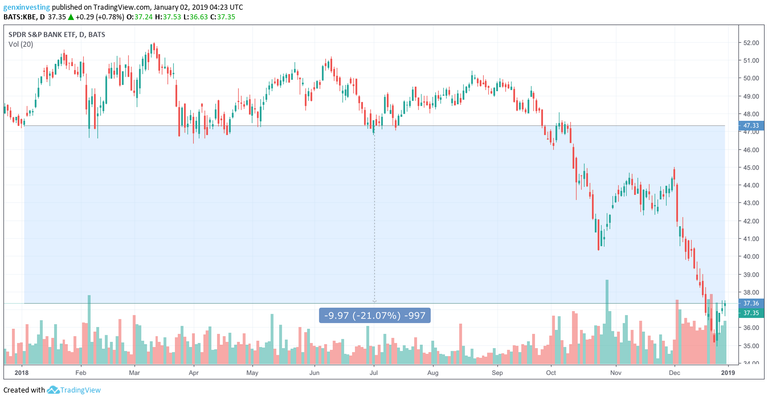
Figure 10: S&P Bank ETF
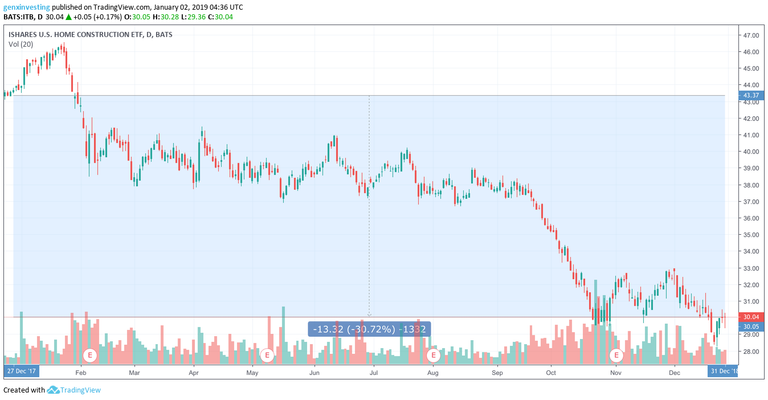
Figure 11: US Home Construction Index
GenXInvesting Strategy to Current US Equity Market
With the overvalued market going into 2019, it is hard to find an attractive investment opportunity with a high margin of safety. The GenXInvesting strategy is to accumulate gunpowder (cash) for potential discounted market prices and open hedge positions against the dollar/inflation through commodities (e.g., gold, oil, agriculture products). To capitalize on the upcoming volatility and correction, the plan is to open strategic short positions for the US index, the auto industry, and companies with a high occurrence of debt (with low quick and current ratio)
The Cryptocurrency Bubble
With the lack of clear regulations and restrictions on the market, the cryptocurrency market has gone through multiple turbulent and exciting rides. Unlike the traditional investment market, the cryptocurrency market allows a simplified onboarding process (with minimum KYC restriction) and no limitation on the capital flow which allows for a quick pump-and-dump scheme. Additionally, the new financial product of cryptocurrencies and tokens can be created out of thin air within a matter of minutes through smart contract platforms such as Ethereum, NEO, WAVE, and QTUM to raise capital for future product launches. This allowed the global bull market of 2017, with the year of initial coin offerings (ICOs) raising over 5 billion dollars. Based on the CoinMarketCap data, the overall cryptocurrency market cap went from about 18 billion to 600 billion (about 33x growth). To give you a perspective, if you have invested $10,000 in the cryptocurrency market in early 2017, your annual return will bring your portfolio up to $330,000. Don’t you wish you can go back in time to take advantage of this investment opportunity? The explosive growth in the market created crypto millionaires and created a fear in the market of missing out on the returns (#FOMO). The investment capital poured into the market and created a bubble.
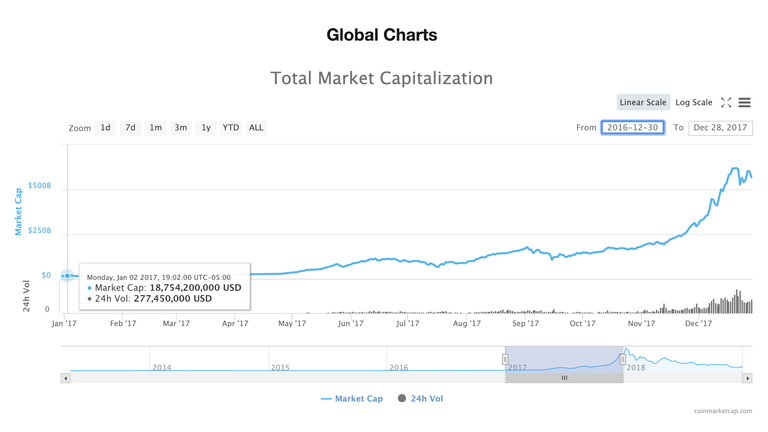
Figure 12: CoinMarketCap 2017 Global Cryptocurrency Market Cap
This story might sound familiar to you if you lived through the 2000s .com bubble. Significant wealth was generated and lost through the .com bubble, making a significant impression on the market. The market bubble is not necessarily a bad phenomenon. The .com bubble allowed necessary fuel for the internet we know today and gave us Google, Facebook, and Amazon. The cryptocurrency investors and enthusiasts must acknowledge the fact that most of the project will fail due to lack of skills, capital, and regulation. The bear market of 2018 lead to the closure of many cryptocurrency scams (e.g., Bitconnect, Oyster Protocol), a shutdown of numerous ICO projects, and blockchain job layoffs. The bubble is a natural process to eliminate the weak projects and identify the strong projects. The potential of the blockchain technology will not get destroyed by the speculative market. The job of the investor is to go through the rigorous due diligence to find the pearl in the ocean.
GenXInvesting Strategy to Current Cryptocurrency Market
The GenXInvesting strategy finds disruptive technologies (e.g., Artificial Intelligence, Cloud, Blockchain) as an attractive investment opportunity. The strategy has been bullish about the cryptocurrency and blockchain market since early 2017 and accumulated the holding throughout 2018. The GenXInvesting Strategy hopes to evolve with the market to identify a solid project for future success and continue to dollar cost average on the investment to lower the risks.
Closing Remarks
I hope you enjoy reading through the GenXInvesting 2019 strategy and market outlooks. This article was written for an educational purpose and not in any way for financial advice. Let us prepare for the worst and hope for the best! Leave a comment on your thoughts and any request for future content.
Happy New Year!
GWK
Congratulations @genxinvesting! You have completed the following achievement on the Steem blockchain and have been rewarded with new badge(s) :
Click here to view your Board
If you no longer want to receive notifications, reply to this comment with the word
STOP