Is it just me, or is Bitcoin full of bear flags lately? If there was one thing I was realizing this morning, Bitcoin was running out of momentum when it was pushing up to $9175 USD. So, I shorted BTC by buying, gasp USDT for only the third time ever. I was in a hurry to close it because the drop was imminent and I hadn't had a chance to pick suitable altcoins to take shelter in.
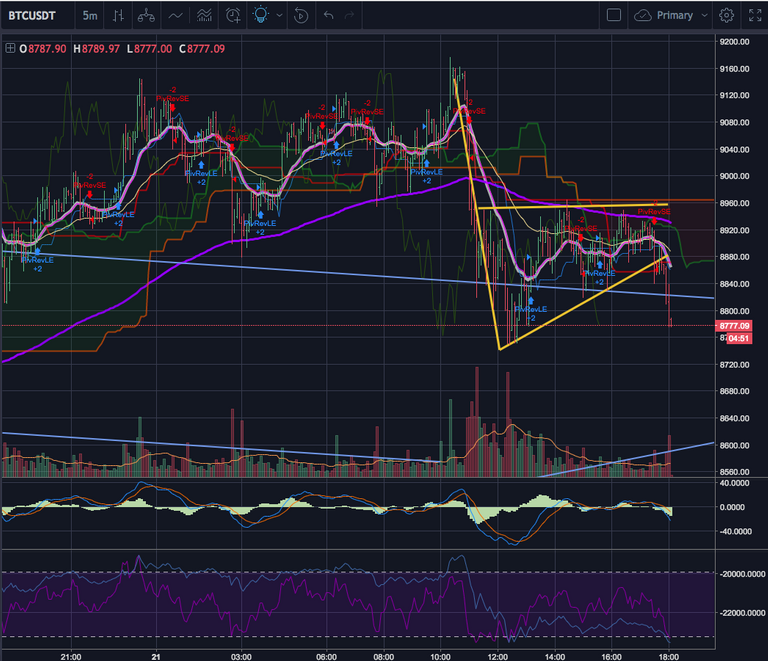
Anyway, long story short, I thought I'd share a bit about Ichimoku Indicator on the 5 minute timeframe as this was where I was hanging out to do some BTC swing trading. I'll start with the latest bear flag drawn in bold yellow. There were two things here that told me Bitcoin was likely getting ready to drop.
First is the bear flag itself. The second is the Kumo cloud.
When things drop sharply and then start oscillating sideways, it's generally a sign that a bear flag is forming. But how can we decide if an ascending wedge (that might also indicate a bullish breakout) or if a bear flag is forming? In this case, as the bear flag began to form, it was plainly obvious it was meeting resistance wit the 200 MA on the 5 minute timeframe chart.
At the same time, the Kumo cloud twisted and came down to a lower elevation. As it widened, it made a very noticeable sharp curve downwards on it's bottom, which basically acts like a buffer to an encroaching bear flag.
The bear flag formation together with the Kumo cloud interaction greatly heightens the chances of breaking to the downside in my book and this is one place where Ichimoku outshines a simpler indicator like MACD, which was not giving off a clear signal in any direction since it was close to zero and in weak bull formation for much of the flag. When it finally turned bear, the flag broke to the downside, but there was far less warning than the Kumo cloud gave us.
I hope the next bull market shows up before summer. It's been a while, and it's starting to be hard on my nerves.
Thanks for providing this TA. Great post, you should do more of these.
good posting
Thank you!
Thanks for sharing your knowledge on reading charts. I’ve have a hard time picking out the indicators myself